Trade: EUR 2y1y/5y5y bull-steepener via mid-curves
Bottom line: Yesterday’s ECB meeting put rate hikes on the table, albeit still some way off and the market for short rates will now be more volatile as opinions on the timing of hikes ebbs and flows. In the past month, the EUR rates market has been driven first by Italy and then by the ECB’s announcements (and fears), and the curve has shown a bull-steepening / bear-flattening dynamic as short rates lead. However this is not reflected yet in the implied volatility market (though this is changing), which opens up the (fast-disappearing) opportunity to set conditional trades on attractive terms. Here I am suggesting a 2y1y/5y5y bull-steepener via mid-curve receivers, partly for the rolldown and partly for increased Italy tension or a continuation of the market’s bullish response to the ECB. It’s also worth considering the straddle version of the trade if you don’t have a directional bias.
Trade:
Buy EUR 990mm 3m2y1y mid-curve receiver atmf (k=0.382%)
Sell EUR 160mm 3m5y5y mid-curve receiver atmf (k=1.617%)
for zero-cost indicative
Spot references:
2y1y: 0.287%
5y5y: 1.573%
Underlying DV01:
2y1y: EUR 100k/bp
5y5y: EUR 76k/bp
Net Delta at inception: EUR 14k/bp long the market
Alternative: Buy mid-curve straddles instead of receivers
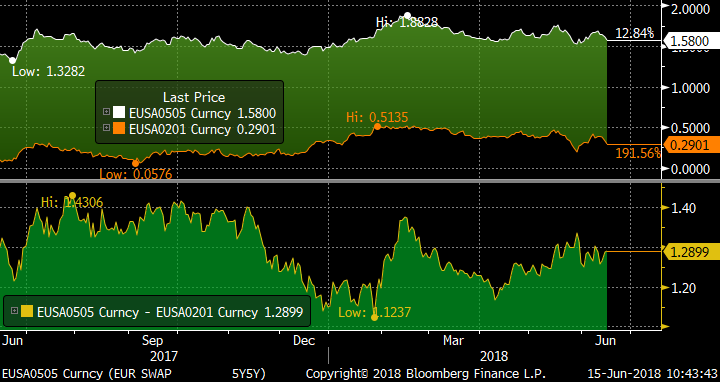
Rationale: The ECB has given us a roadmap for the coming year: new purchases to be wound down from September to December; and no rate rises before next summer. The street is predicting the first hike between Sept and Dec 2019. From now on, short rates in Europe are increasing “in play”, as the ECB becomes the centre of attention (rather than more global forces which swing the longer end of the curve).
Spread of EUR 2y1y and 5y5y rates:
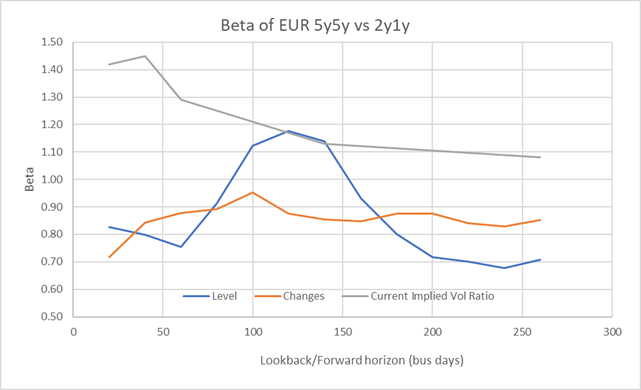
This is apparent in the relative changes in implied volatility, where the ratio of implied volatilities on shorter tails has increased relative to longer tails. However the ratios of implied volatilities are still running higher than the observed realized betas between the two rates. The chart shows the realized beta for EUR 5y5y vs 2y1y (both on levels and daily changes) for different look-back periods. The past few months have seen a decline of the realized beta, especially when compared to the current levels of forward-looking implied volatilities.
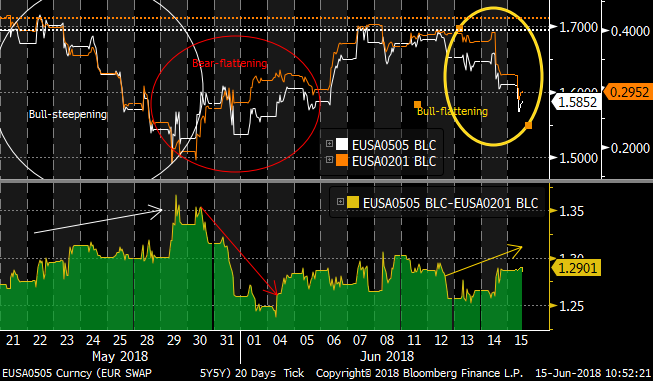
Empirically we have seen the bull-steepening / bear-flattening dynamic in recent events: during the recent Italy scares and in the aftermath of yesterday’s ECB meeting.
The mismatch with the relative levels of implied volatility allows us to construct zero-cost curve trades with an over-weighted nominal of the short rate tail compared to simple DV01 weighting of the underlying. The table shows different expiries for a 2y1y/5y5y mid-curve bull-steepener.
|
Expiry |
ZC DV01 ratio |
2y1y Roll* |
5y5y Roll* |
Net Roll (bp)* |
|
1m |
1.42 |
3.1 |
-1.4 |
2.1 |
|
3m |
1.29 |
9.5 |
-4.4 |
6.1 |
|
6m |
1.13 |
18.8 |
-8.6 |
11.2 |
|
1y |
1.08 |
36.2 |
-16.1 |
21.3 |
*Positive roll-down for receivers; negative for payers
Why have I chosen 2y1y and 5y5y? At the short end, the alternative would be 1y1y tails, however the current 1y1y is only 6bp or so above its lows of the past calendar year, whereas 2y1y is around 24bp above: ie there is more downside room in rates in a rally for 2y1y. The implied volatility in mid-curves peaks around the 3y1y rate (which is perhaps not surprising), so buying 3y1y tails is not attractive in terms of entry point. Conversely for the longer rate the higher the implied vol (and cost) the better, and 5y5y implied vol is some 5bp/y above 10y10y. Of course, I’m happy to look at other combinations upon request!
Why a 3m expiry? The largest roll-down protection comes with longer expiries, but the relative roll compared to the horizon term is reduced. The shorter expiries have a better DV01 ratio: ie you get relatively more of the receiver you are long than the one you are short. A 3m horizon is thus the compromise, and takes us just past the 13-Sept ECB date, so covers the next two meetings.
Risks: As in all conditional curve trades, the primary risk is that the dynamic of the curve changes from bull-steepening to bull-flattening. This might occur if for example there was a US-led rally, while the EUR economic outlook remained unchanged. However, as we have seen in the Italy crisis, the market views the ECB as sensitive to the economic outlook (be it the threat from tariffs, or political risk), so a weaker global growth outlook should also dent expectations for ECB action.
An alternative trade is to focus more on the low realized ratio versus the implied, and buy straddles rather than receivers. This allows you to benefit if my view that we stay in a bear-flattening/bull-steepening regime proves correct, regardless of whether the market raises or lowers expectations of ECB moves.
Would love to hear your thoughts!
Best wishes,
David Sansom
![]() image001.jpg@01D21F13.B69A4950">
image001.jpg@01D21F13.B69A4950">
UK: 14-16 Dowgate Hill, London EC4R 2SU
US: 245 Park Ave, 39th Floor, NY, NY, 10167
Office: +44 (0) 203 143 4180
Mobile: +44 (0) 7976 204490
Email: david.sansom@astorridge.com
Web: www.AstorRidge.com
This marketing was prepared by David Sansom, a consultant with Astor Ridge. It is not appropriate to characterize this e-mail as independent investment research as referred to in MiFID and that it should be treated as a marketing communication even if it contains a trade recommendation. A history of marketing materials and research reports can be provided upon request in compliance with the European Commission’s Market Abuse Regulation. Astor Ridge takes no proprietary trading risk, has no market making facilities, and has no position in any security we discuss in this e-mail. The views in this e-mail are those of the author(s) and are subject to change, and Astor Ridge has no obligation to update its opinions or the information in this publication. If this e-mail contains opinions or recommendations, those opinions or recommendations reflect solely and exclusively those of the author, and such opinions were prepared independently of any other interests, including those of Astor Ridge and/or its affiliates. This publication does not constitute personal investment advice or take into account the individual financial circumstances or objectives of the those who receive it. The securities discussed herein may not be suitable for all investors. Astor Ridge recommends that investors independently evaluate each issuer, security or instrument discussed herein, and consult any independent advisors they believe necessary. The value of, and income from, any investment may fluctuate from day to day as a result of changes in relevant economic markets (including changes in market liquidity). The information herein is not intended to predict actual results, which may differ substantially from those reflected. Past performance is not necessarily indicative of future results.
You should not use or disclose to any other person the contents of this e-mail or its attachments (if any), nor take copies. This e-mail is not a representation or warranty and is not intended nor should it be taken to create any legal relations, contractual or otherwise. This e-mail and any files transmitted with it are confidential, may be legally privileged, and are for the sole use of the intended recipient. Copyright in this e-mail and any accompanying document created by Astor Ridge LLP is owned by Astor Ridge LLP.
Astor Ridge LLP is regulated by the Financial Conduct Authority (FCA): Registration Number 579287
Astor Ridge LLP is Registered in England and Wales with Companies House: Registration Number OC372185
Astor Ridge NA LLP is a member of FINRA/SIPC: CRD Number 282626
Astor Ridge NA LLP is Registered in England and Wales with Companies House: Registration Number OC401796
Taking a quick profit: Tactical trade for Italy relaxation: EUR bear-flattener via 1m mid-curve payers
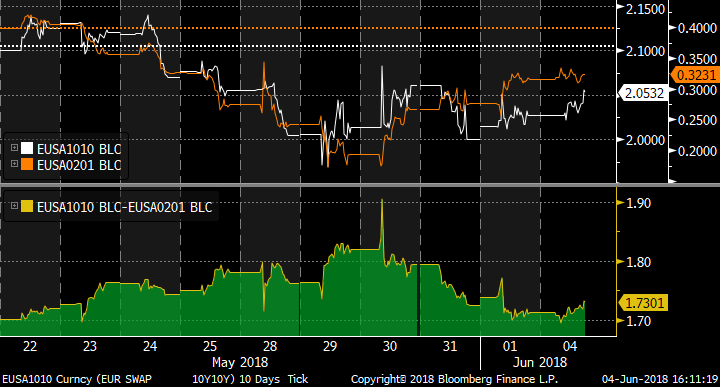
Last week I set a tactical EUR 2y1y/10y10y bear-flattener through mid-curves in my shadow portfolio. The trade has made 4.5bp in a few days, so I am booking this now. The chart shows the intraday pricing for 2y1y and 10y10y. Initially the curve was flattening as the Italy effect receded. However today’s price action has seen the short end stationary while long rates have continued to sell-off. This switch (though it might be temporary) to a bear-steepening mode has prompted me to book the profit early on this.
Best
David
Original writeup:
Bottom line: Italy is driving a bull-steepening of the EUR curve in forward space, which makes the pricing of the reversal bear-flattening trade attractive via mid-curve options.
Trade:
Buy EUR 995mm 1m2y1y mid-curve payer atmf (k=0.264%)
Sell EUR 120mm 1m10y10y mid-curve payer atmf (k=2.03%)
Premium take out of 0.7bp (indicative mid)
Atmf strike at 176.6bp vs 179.8 spot.
Rationale: The recent explosion of Italy risk has driven a bull-steepening of the EUR curve in forward space, as the dampening of ECB rate hike expectations outpaces yield moves at the long-end. It is therefore reasonable to anticipate that any relaxation of the stress surrounding the Italian political situation will provoke a general sell-off in rates and a re-flattening of the curve.

Clearly for the past 3m of history, the effect of the crisis has been much more marked for the 2y1y rate than 10y10y.
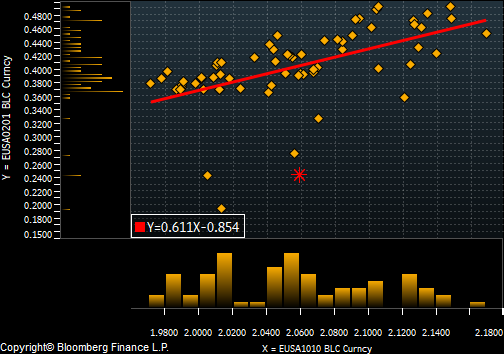
This kind of dynamic favours conditional curve trades: in the near term, any flattening of the 2y1y/10y10y spread should go hand-in-hand with a sell-off in rates. Similarly a further steepening should see rates rally further, putting payer swaptions out of the money. Currently the implied vol on 1m2y1y is 51bp/y compared to 58bp/y implied on 1m10y10y, which allows a zero (negative) cost structure. The downside is the 3bp of negative roll on the flattener.
Risks: The main risk is an exogenous event (eg Trump / China) which drives global rates higher. In that scenario, longer rates could sell-off while short end expectations remain muted ie: a bear-steepening of the curve. Currently Italy is centre-stage, and I expect that to be the driver for the next month, which is the main reason for such a short expiry.
What do you think?
David
David Sansom
![]() image001.jpg@01D21F13.B69A4950">
image001.jpg@01D21F13.B69A4950">
UK: 14-16 Dowgate Hill, London EC4R 2SU
US: 245 Park Ave, 39th Floor, NY, NY, 10167
Office: +44 (0) 203 143 4180
Mobile: +44 (0) 7976 204490
Email: david.sansom@astorridge.com
Web: www.AstorRidge.com
This marketing was prepared by David Sansom, a consultant with Astor Ridge. It is not appropriate to characterize this e-mail as independent investment research as referred to in MiFID and that it should be treated as a marketing communication even if it contains a trade recommendation. A history of marketing materials and research reports can be provided upon request in compliance with the European Commission’s Market Abuse Regulation. Astor Ridge takes no proprietary trading risk, has no market making facilities, and has no position in any security we discuss in this e-mail. The views in this e-mail are those of the author(s) and are subject to change, and Astor Ridge has no obligation to update its opinions or the information in this publication. If this e-mail contains opinions or recommendations, those opinions or recommendations reflect solely and exclusively those of the author, and such opinions were prepared independently of any other interests, including those of Astor Ridge and/or its affiliates. This publication does not constitute personal investment advice or take into account the individual financial circumstances or objectives of the those who receive it. The securities discussed herein may not be suitable for all investors. Astor Ridge recommends that investors independently evaluate each issuer, security or instrument discussed herein, and consult any independent advisors they believe necessary. The value of, and income from, any investment may fluctuate from day to day as a result of changes in relevant economic markets (including changes in market liquidity). The information herein is not intended to predict actual results, which may differ substantially from those reflected. Past performance is not necessarily indicative of future results.
You should not use or disclose to any other person the contents of this e-mail or its attachments (if any), nor take copies. This e-mail is not a representation or warranty and is not intended nor should it be taken to create any legal relations, contractual or otherwise. This e-mail and any files transmitted with it are confidential, may be legally privileged, and are for the sole use of the intended recipient. Copyright in this e-mail and any accompanying document created by Astor Ridge LLP is owned by Astor Ridge LLP.
Astor Ridge LLP is regulated by the Financial Conduct Authority (FCA): Registration Number 579287
Astor Ridge LLP is Registered in England and Wales with Companies House: Registration Number OC372185
Astor Ridge NA LLP is a member of FINRA/SIPC: CRD Number 282626
Astor Ridge NA LLP is Registered in England and Wales with Companies House: Registration Number OC401796
Tactical trade for Italy relaxation: EUR bear-flattener via 1m mid-curve payers
Bottom line: Italy is driving a bull-steepening of the EUR curve in forward space, which makes the pricing of the reversal bear-flattening trade attractive via mid-curve options.
Trade:
Buy EUR 995mm 1m2y1y mid-curve payer atmf (k=0.264%)
Sell EUR 120mm 1m10y10y mid-curve payer atmf (k=2.03%)
Premium take out of 0.7bp (indicative mid)
Atmf strike at 176.6bp vs 179.8 spot.
Rationale: The recent explosion of Italy risk has driven a bull-steepening of the EUR curve in forward space, as the dampening of ECB rate hike expectations outpaces yield moves at the long-end. It is therefore reasonable to anticipate that any relaxation of the stress surrounding the Italian political situation will provoke a general sell-off in rates and a re-flattening of the curve.
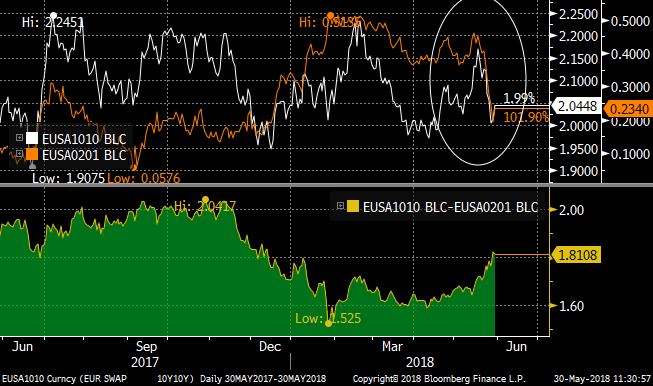
Clearly for the past 3m of history, the effect of the crisis has been much more marked for the 2y1y rate than 10y10y.
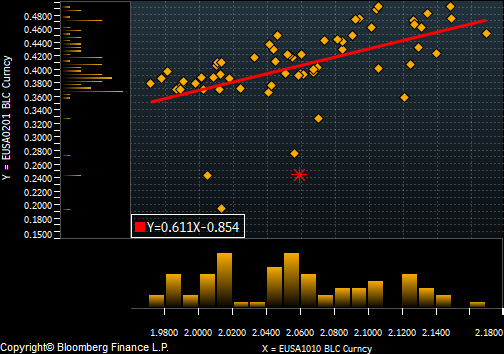
This kind of dynamic favours conditional curve trades: in the near term, any flattening of the 2y1y/10y10y spread should go hand-in-hand with a sell-off in rates. Similarly a further steepening should see rates rally further, putting payer swaptions out of the money. Currently the implied vol on 1m2y1y is 51bp/y compared to 58bp/y implied on 1m10y10y, which allows a zero (negative) cost structure. The downside is the 3bp of negative roll on the flattener.
Risks: The main risk is an exogenous event (eg Trump / China) which drives global rates higher. In that scenario, longer rates could sell-off while short end expectations remain muted ie: a bear-steepening of the curve. Currently Italy is centre-stage, and I expect that to be the driver for the next month, which is the main reason for such a short expiry.
What do you think?
David
David Sansom
![]() image001.jpg@01D21F13.B69A4950">
image001.jpg@01D21F13.B69A4950">
UK: 14-16 Dowgate Hill, London EC4R 2SU
US: 245 Park Ave, 39th Floor, NY, NY, 10167
Office: +44 (0) 203 143 4180
Mobile: +44 (0) 7976 204490
Email: david.sansom@astorridge.com
Web: www.AstorRidge.com
This marketing was prepared by David Sansom, a consultant with Astor Ridge. It is not appropriate to characterize this e-mail as independent investment research as referred to in MiFID and that it should be treated as a marketing communication even if it contains a trade recommendation. A history of marketing materials and research reports can be provided upon request in compliance with the European Commission’s Market Abuse Regulation. Astor Ridge takes no proprietary trading risk, has no market making facilities, and has no position in any security we discuss in this e-mail. The views in this e-mail are those of the author(s) and are subject to change, and Astor Ridge has no obligation to update its opinions or the information in this publication. If this e-mail contains opinions or recommendations, those opinions or recommendations reflect solely and exclusively those of the author, and such opinions were prepared independently of any other interests, including those of Astor Ridge and/or its affiliates. This publication does not constitute personal investment advice or take into account the individual financial circumstances or objectives of the those who receive it. The securities discussed herein may not be suitable for all investors. Astor Ridge recommends that investors independently evaluate each issuer, security or instrument discussed herein, and consult any independent advisors they believe necessary. The value of, and income from, any investment may fluctuate from day to day as a result of changes in relevant economic markets (including changes in market liquidity). The information herein is not intended to predict actual results, which may differ substantially from those reflected. Past performance is not necessarily indicative of future results.
You should not use or disclose to any other person the contents of this e-mail or its attachments (if any), nor take copies. This e-mail is not a representation or warranty and is not intended nor should it be taken to create any legal relations, contractual or otherwise. This e-mail and any files transmitted with it are confidential, may be legally privileged, and are for the sole use of the intended recipient. Copyright in this e-mail and any accompanying document created by Astor Ridge LLP is owned by Astor Ridge LLP.
Astor Ridge LLP is regulated by the Financial Conduct Authority (FCA): Registration Number 579287
Astor Ridge LLP is Registered in England and Wales with Companies House: Registration Number OC372185
Astor Ridge NA LLP is a member of FINRA/SIPC: CRD Number 282626
Astor Ridge NA LLP is Registered in England and Wales with Companies House: Registration Number OC401796
How are we doing? Shadow OTC portfolio update
Portfolio since 21st March: USD +560k, Ytd +711k
Summary: A much better month for my shadow portfolio. The UK curve flattened sharply vs the US on MPC rate hike optimism, and thankfully for once I booked the profit: as the box has now sharply reversed following Carney’s unexpectedly dovish comments which stunted the prospects for a May hike. I have kept the 1y expiry CMS trade on GBP 2y-10y vs USD, though it has moved against me, however I have taken the opportunity to add the same trade but on a very short, one-month horizon and using floors (given the risk that the MPC does in fact do nothing in May). Still in the UK, the Gilt market flattened 10-30 into the quarter-/fiscal year-end and this opened up a discrepancy with the prevailing relationship to 2y1y (ie short rate expectations): as advised by my colleague, the 10-30 re-steepened so I booked a quick profit. Finally, the ECB minutes showed a distinct reluctance to confirm a rising path for inflation which led me to set a bear-steepener on 3y1y/5y5y with an expiry before the June ECB meeting. To my mind the down-playing of inflationary risks (eg from a trade war) was significant and likely to keep a cap on 3y1y in the short term, until the ECB likely makes a decision on PSPP2 at the June meeting.
My general portfolio can be characterized as long-term strategic curve plays (flatter in EUR, steeper in GBP) with more tactical event-based trades. In EUR, I see the dynamic as being long-term flattening as accommodation is removed, but in the short-term the market can continue to be disappointed with the pace of moves. In the US, spreads like 2y1y/3y1y has been flirting with negative territory, but has stabilized for now: I am hesitant to put new US steepening into the book until I see that spread sit around zero for some time.
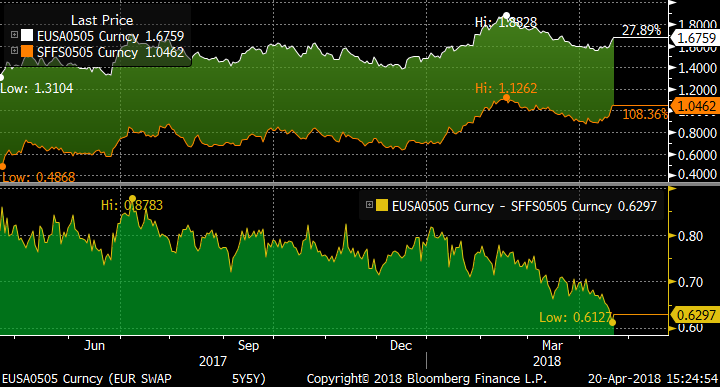
Others will have pointed out the narrowing of the EUR-CHF spread in 5y5y. This has taken place in the context of a sell-off, with CHF 5y5y moving faster than EUR. In an ideal world, one would buy CHF mid-curve receivers on 5y5y and sell EUR. Unfortunately CHF mid-curves are rare beasts, so one alternative would be to create the synthetic mid-curve by buying 2 lots of 3m10y receivers and selling 1 lot of 3m5y (this ignores the correlation risk of 5y & 10y, but is an acceptable short-term proxy).
So the trade I will be looking at on Monday is:
Buy 2 x CHF 3m10y receivers
Sell 1 x CHF 3m5y receivers
Sell 1 x EUR 3m5y5y mid-curve receiver
DV01/FX weighted
Let me know if you’d like more details. CHF vol is not the most liquid market but an opportunity might present itself. Otherwise, have a great weekend!
EUR/CHF 5y5y
Portfolio Changes:
- Closed GBP/USD 2y-10y, 1y fwd for profit
- Opened EUR CMS 10-5 collar
- Opened & closed GBP 10-30 vs 2y1y for profit
- Opened EUR 3y1y/5y5y bear steepener
- Opened GBP/USD 2y-10y, 1m floors
Portfolio since 1st Jan
|
Trade Idea |
Entered |
Level |
Size |
Status |
Exit/Current Level |
Exit Date |
P&L k USD |
|
US 2-10 steepener via CMS caps |
28-Dec-17 |
0 bp |
USD 25 k/bp |
CLOSED |
0 bp |
15-Jan-18 |
0 |
|
RX/UB ASW Box |
28-Dec-17 |
-6.1 bp |
EUR 50 k/bp |
CLOSED |
-5.2 bp |
06-Mar-18 |
-56 |
|
EUR 1y3y/5y5y Mid-curve flattener |
28-Dec-17 |
13.7 bp |
EUR 20 k/bp |
CLOSED |
29 bp |
31-Jan-18 |
380 |
|
GBP 1y1y1y MC Payer spread |
28-Dec-17 |
0.7 bp |
GBP 25 k/bp |
CLOSED |
-1 bp |
31-Jan-18 |
-60 |
|
EUR 9m1y1y/9m1y5y Bear Flattener |
28-Dec-17 |
4.2 bp |
EUR 25 k/bp |
CLOSED |
0 bp |
30-Jan-18 |
-130 |
|
Receive GBP/USD 5y5y xccy basis |
28-Dec-17 |
1 bp |
GBP 40 k/bp |
CLOSED |
6.4 bp |
28-Feb-18 |
-297 |
|
EUR 2-5-10 weighted swap fly |
28-Dec-17 |
-28.1 bp |
EUR 40 k/bp |
CLOSED |
-25 bp |
25-Jan-18 |
-154 |
|
GBP 2y-10y Bull-steepener |
05-Jan-18 |
0 bp |
GBP 20 k/bp |
OPEN |
0 bp |
0 |
|
|
EUR 2y2y/5y10y Bull-Steepener |
30-Jan-18 |
0 bp |
EUR 25 k/bp |
CLOSED |
4 bp |
05-Mar-18 |
123 |
|
USD 2y-10y, 1y fwd steepener |
02-Feb-18 |
22 bp |
USD 25 k/bp |
CLOSED |
20.5 bp |
21-Feb-18 |
-38 |
|
GBP/USD 2y-10y 1y fwd Swaps |
21-Feb-18 |
-25.5 bp |
GBP 25 k/bp |
CLOSED |
-10.8 bp |
23-Mar-18 |
521 |
|
GBP 2y-10y vs USD CMS Caps |
21-Feb-18 |
0 bp |
GBP 25 k/bp |
OPEN |
-0.8 bp |
-29 |
|
|
EUR 3y1y/10y10y flattener |
06-Mar-18 |
124 bp |
EUR 25 k/bp |
CLOSED |
120 bp |
08-Mar-18 |
123 |
|
EUR CMS 10-5 collar |
06-Mar-18 |
0.5 bp |
EUR 40 k/bp |
OPEN |
-0.2 bp |
-35 |
|
|
GBP 10-30 vs 2y1y |
27-Mar-18 |
29 bp |
GBP 40 k/bp |
CLOSED |
33.8 bp |
09-Apr-18 |
271 |
|
EUR 3y1y/5y5y bear steepener |
12-Apr-18 |
0 bp |
EUR 40 k/bp |
OPEN |
1.9 bp |
94 |
|
|
GBP/USD 2y-10y, 1m Floors |
20-Apr-18 |
0.6 bp |
GBP 25 k/bp |
OPEN |
0.5 bp |
-4 |
|
|
Total YTD |
711 |
Note on trade sizing: Each trade is sized to generate approx. USD 150k 2y 99% hist. VaR at inception with no netting
David Sansom
![]() image001.jpg@01D21F13.B69A4950">
image001.jpg@01D21F13.B69A4950">
UK: 14-16 Dowgate Hill, London EC4R 2SU
US: 245 Park Ave, 39th Floor, NY, NY, 10167
Office: +44 (0) 203 143 4180
Mobile: +44 (0) 7976 204490
Email: david.sansom@astorridge.com
Web: www.AstorRidge.com
This marketing was prepared by David Sansom, a consultant with Astor Ridge. It is not appropriate to characterize this e-mail as independent investment research as referred to in MiFID and that it should be treated as a marketing communication even if it contains a trade recommendation. A history of marketing materials and research reports can be provided upon request in compliance with the European Commission’s Market Abuse Regulation. Astor Ridge takes no proprietary trading risk, has no market making facilities, and has no position in any security we discuss in this e-mail. The views in this e-mail are those of the author(s) and are subject to change, and Astor Ridge has no obligation to update its opinions or the information in this publication. If this e-mail contains opinions or recommendations, those opinions or recommendations reflect solely and exclusively those of the author, and such opinions were prepared independently of any other interests, including those of Astor Ridge and/or its affiliates. This publication does not constitute personal investment advice or take into account the individual financial circumstances or objectives of the those who receive it. The securities discussed herein may not be suitable for all investors. Astor Ridge recommends that investors independently evaluate each issuer, security or instrument discussed herein, and consult any independent advisors they believe necessary. The value of, and income from, any investment may fluctuate from day to day as a result of changes in relevant economic markets (including changes in market liquidity). The information herein is not intended to predict actual results, which may differ substantially from those reflected. Past performance is not necessarily indicative of future results.
You should not use or disclose to any other person the contents of this e-mail or its attachments (if any), nor take copies. This e-mail is not a representation or warranty and is not intended nor should it be taken to create any legal relations, contractual or otherwise. This e-mail and any files transmitted with it are confidential, may be legally privileged, and are for the sole use of the intended recipient. Copyright in this e-mail and any accompanying document created by Astor Ridge LLP is owned by Astor Ridge LLP.
Astor Ridge LLP is regulated by the Financial Conduct Authority (FCA): Registration Number 579287
Astor Ridge LLP is Registered in England and Wales with Companies House: Registration Number OC372185
Astor Ridge NA LLP is a member of FINRA/SIPC: CRD Number 282626
Astor Ridge NA LLP is Registered in England and Wales with Companies House: Registration Number OC401796
Trade: CMS Floor box GBP 10-2 vs USD 10-2 for a reversal of the Carney-induced UK steepening
Bottom line: This is a trade I have had before, but the Carney-led steepening of the GBP curve relative to the US has brought me back to it: but this time via CMS floors. It is a tactical one month play for a reversal of the steepening, with an expiry that spans the upcoming MPC meeting on 10th May (and the Fed meeting on 2nd May). The GBP/USD 2y-10y box is out of line, but this time I see the risk as further GBP steepening so I am proposing a curve floor structure.
Trade:
Buy GBP 1bn 1m CMS 10-2 floor atmf-2bp (k=46bp)
Sell USD 1.4bn 1m CMS 10-2 floor atmf-2bp (k=18.5bp)
Fwd box strike at 27.5bp, with spot at 26.9bp.
Indicative cost (mid) at 0.6bp running (above notionals are GBP 100k/bp on the underlying curve at expiry).
The spot box: GBP 2y-10y less USD 2y-10y
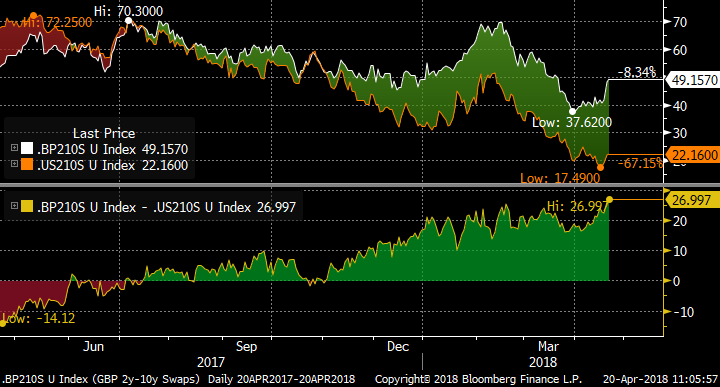
The strikes displayed graphically on the recent evolution of the US and GBP curves:

Rationale: The UK market had a double-take on Carneys after-hours comments on the likelihood of hikes: with the curve steepening hard on the dovish outlook. This has held today despite Saunders’s repetition of his data-dependent stance. My macro view is that the MPC hikes in May, Carney notwithstanding, but the market’s pricing has the May SONIA at 60bp and the probability of a hike at a shade over 50%.
If there is a hike in May, I’d expect the curve to flatten in GBP, back to (if not through) the 37bp recent low, as long as the statement is not strongly “one and done”. The economic consensus is for UK data to be equivocal at best and we may get a steer that further hikes are not preordained. Even so, the GBP flattening should take the trade through the strike at 46bp.
If May is unchanged, then GBP 2y-10y will steepen further and if recent history is maintained the US curve will steepen in sympathy though to a lesser extent. In this scenario, both floors expire out of the money, but the loss is limited to the premium paid.
During the same one-month period we have the FOMC meeting on 2nd May. The market is pricing a sub-10% chance of a move, though it is possible that the statement may steepen the rate trajectory (we wont get the minutes until after this trade has expired). So there is a small risk of Fed-induce flattening coming out of the US, which is the primary reason for shifting the options 2bp out of the money to take the US curve strike down to the recent flattest in US 2y-10y.
As outlined, the main risk is that the US curve (already very flat) flattens further while the GBP curve does not. If the US flattening is led by a long-end rally (in 10y) then the UK curve should also flatten in the near-term but not by the same amount. The forward strike of the USD floor is 4bp out of the money versus spot and this should mitigate but not eliminate this risk.
As always, any thoughts and comments are appreciated!
Best
David
David Sansom
![]() image001.jpg@01D21F13.B69A4950">
image001.jpg@01D21F13.B69A4950">
UK: 14-16 Dowgate Hill, London EC4R 2SU
US: 245 Park Ave, 39th Floor, NY, NY, 10167
Office: +44 (0) 203 143 4180
Mobile: +44 (0) 7976 204490
Email: david.sansom@astorridge.com
Web: www.AstorRidge.com
This marketing was prepared by David Sansom, a consultant with Astor Ridge. It is not appropriate to characterize this e-mail as independent investment research as referred to in MiFID and that it should be treated as a marketing communication even if it contains a trade recommendation. A history of marketing materials and research reports can be provided upon request in compliance with the European Commission’s Market Abuse Regulation. Astor Ridge takes no proprietary trading risk, has no market making facilities, and has no position in any security we discuss in this e-mail. The views in this e-mail are those of the author(s) and are subject to change, and Astor Ridge has no obligation to update its opinions or the information in this publication. If this e-mail contains opinions or recommendations, those opinions or recommendations reflect solely and exclusively those of the author, and such opinions were prepared independently of any other interests, including those of Astor Ridge and/or its affiliates. This publication does not constitute personal investment advice or take into account the individual financial circumstances or objectives of the those who receive it. The securities discussed herein may not be suitable for all investors. Astor Ridge recommends that investors independently evaluate each issuer, security or instrument discussed herein, and consult any independent advisors they believe necessary. The value of, and income from, any investment may fluctuate from day to day as a result of changes in relevant economic markets (including changes in market liquidity). The information herein is not intended to predict actual results, which may differ substantially from those reflected. Past performance is not necessarily indicative of future results.
You should not use or disclose to any other person the contents of this e-mail or its attachments (if any), nor take copies. This e-mail is not a representation or warranty and is not intended nor should it be taken to create any legal relations, contractual or otherwise. This e-mail and any files transmitted with it are confidential, may be legally privileged, and are for the sole use of the intended recipient. Copyright in this e-mail and any accompanying document created by Astor Ridge LLP is owned by Astor Ridge LLP.
Astor Ridge LLP is regulated by the Financial Conduct Authority (FCA): Registration Number 579287
Astor Ridge LLP is Registered in England and Wales with Companies House: Registration Number OC372185
Astor Ridge NA LLP is a member of FINRA/SIPC: CRD Number 282626
Astor Ridge NA LLP is Registered in England and Wales with Companies House: Registration Number OC401796
Trade: EUR 3y1y/5y5y tactical bear-steepener based on ECB inaction
Bottom line: Today’s ECB minutes reinforce the reluctance to call an end to accommodation. In light of this, I’m looking at selling the risk of short-rates rising significantly before the June ECB meeting.
Trade:
Sell EUR 995mm 2m3y1y mid-curve payer atmf+10bp (k=0.904%)
Buy EUR 210mm 2m5y5y mid-curve payer atmf+8bp (k=1.672%)
Expiry 14-Jun-18
For zero-cost indicative mid. Equivalent to EUR 100k/bp of the underlying swap.
(ABB 6s on both underlying swaps)
Forward strike entry at 76.8bp, vs spot 3y1y/5y5y at 81.2bp.

Rationale: Over the medium term I see the EUR curve flattening, as the ECB eventually moves to adjusting the deposit rate higher. However today’s Minutes of the 8th March meeting show little indication to rush and if anything reinforce the cautious approach of the majority of board members. To me this was the key section:
“The view was put forward that the Governing Council’s criteria for a sustained adjustment in the path of inflation could be assessed as close to being satisfied over a medium-term horizon. However, the broadly agreed conclusion was that the evidence for a sustained rise in inflation towards levels consistent with the Governing Council’s inflation aim was still not sufficient.”
The next meetings are on 26th April and 14th June, so it is no coincidence that I have chosen a 2m expiry, which comes the morning of the 2nd meeting. The basic premise is that with the ECB sitting on its hands, the realized volatility in the 3y1y rate should undershoot the implied volatility and the realized volatility in longer rates. This reticence is mirrored by the market implied volatility on mid-curve options. The chart shows atm implied volatility for 3y1y and 5y5y mid-curve tails. Implied vol for 1m3y1y is relatively low (certainly lower than 5y5y) and picks up for 2m expiries (to be higher than 5y5y).

Thus it is attractive to sell volatility on 2m3y1y against 2m5y5y. The directionality of the curve has been inconsistent. In the most recent past (ie since mid-Feb) the curve has been bull-flattening. Since the upside to short rates appears capped in the near-term (if my read of the ECB’s intentions is accurate), I am willing to sell payers there and enter a bear-steepener as longer-rates drive the curve.
The vol differential for 2m expiries means that premium can be taken out of the trade. Alternatively, the strike can be set atmf+10bp on the 3y1y and only atmf+8bp on the 5y5y, which gives a further 2bp margin at expiry. In rate terms, the steepener has positive roll-down over the lifetime of the trade. Put together, the forward strike entry is 4.4bp below the spot 3y1y/5y5y spread. In addition, roll-down of the vol surface favours being short vol on 3y1y compared to 5y5y which adds another 0.9bp of rate cushion.
The main risk to the trade is that the market sharply reprices (ie brings forward) the ECB’s tightening of conditions. By moving both payers out of the money (and taking into account the rolldown), I’ve tried to build a buffer but the risk is still there. That said, elsewhere in the ECB statement they nodded to the current risks to global trade so if there were a significant flight to quality move and rally in the belly (eg 5y5y) that might be expected to temper any appetite for rate hikes.
As always, love to hear your thoughts!
Best,
David Sansom
![]() image001.jpg@01D21F13.B69A4950">
image001.jpg@01D21F13.B69A4950">
UK: 14-16 Dowgate Hill, London EC4R 2SU
US: 245 Park Ave, 39th Floor, NY, NY, 10167
Office: +44 (0) 203 143 4180
Mobile: +44 (0) 7976 204490
Email:
Web: www.AstorRidge.com
This marketing was prepared by David Sansom, a consultant with Astor Ridge. It is not appropriate to characterize this e-mail as independent investment research as referred to in MiFID and that it should be treated as a marketing communication even if it contains a trade recommendation. A history of marketing materials and research reports can be provided upon request in compliance with the European Commission’s Market Abuse Regulation. Astor Ridge takes no proprietary trading risk, has no market making facilities, and has no position in any security we discuss in this e-mail. The views in this e-mail are those of the author(s) and are subject to change, and Astor Ridge has no obligation to update its opinions or the information in this publication. If this e-mail contains opinions or recommendations, those opinions or recommendations reflect solely and exclusively those of the author, and such opinions were prepared independently of any other interests, including those of Astor Ridge and/or its affiliates. This publication does not constitute personal investment advice or take into account the individual financial circumstances or objectives of the those who receive it. The securities discussed herein may not be suitable for all investors. Astor Ridge recommends that investors independently evaluate each issuer, security or instrument discussed herein, and consult any independent advisors they believe necessary. The value of, and income from, any investment may fluctuate from day to day as a result of changes in relevant economic markets (including changes in market liquidity). The information herein is not intended to predict actual results, which may differ substantially from those reflected. Past performance is not necessarily indicative of future results.
You should not use or disclose to any other person the contents of this e-mail or its attachments (if any), nor take copies. This e-mail is not a representation or warranty and is not intended nor should it be taken to create any legal relations, contractual or otherwise. This e-mail and any files transmitted with it are confidential, may be legally privileged, and are for the sole use of the intended recipient. Copyright in this e-mail and any accompanying document created by Astor Ridge LLP is owned by Astor Ridge LLP.
Astor Ridge LLP is regulated by the Financial Conduct Authority (FCA): Registration Number 579287
Astor Ridge LLP is Registered in England and Wales with Companies House: Registration Number OC372185
Astor Ridge NA LLP is a member of FINRA/SIPC: CRD Number 282626
Astor Ridge NA LLP is Registered in England and Wales with Companies House: Registration Number OC401796
Portfolio update: Closing out "Tactical Year-end Trade: GBP 10-30 steepener hedged with short-rates"
At the tail-end of March, I suggested fading the idiosyncratic flattening of the GBP 10-30 curve, as it was out of line with short rate expectations (eg the 2y1y rate) on the run-in to the fiscal year-end in the UK.
The trade has reverted a good deal since then, and with the 30y Gilt auction tomorrow I’m booking the gains here at 33.8 bp, having entered at 29bp.
Thanks to George Whitehead for his sage advice on the Gilt market, and the flows driving it.

Best wishes,
David
The original write-up:
Bottom-line: GBP 10-30 has flattened too far relative to short-rate expectations, as demand of long-end UK paper has outstripped supply in the thin market ahead of fiscal year-end. Set a tactical steepener, hedged with a regression-weighted amount of short-rates. One to look at today, ahead of this afternoon’s long-end APF.
Trade:
Recv GBP 107mm 1y10y swap
Pay GBP 40.5mm 1y30y swap
Pay 255mm 2y1y swap
(equivalent to GBP 100k/bp on the 10y-30y and 25k/bp of 2y1y)
Positive rolldown of +0.5bp over the first 3m.
Bloomberg CIX for the relationship:
100 * (BPSW0130 Curncy - BPSW0110 Curncy) + 25 * BPSW0201 Curncy
On this index, enter at 29. Target 36bp. Stop at 26.5bp.

The residual of the 10-30 vs 25% 2y1y regression (using the 1:0.25 weights):

Rationale: For the past year, as the UK has moved towards a hiking cycle, the long-end curve slope has been correlated with the short rate (as exemplified by 2y1y) as it has in the US. However in the past month, the 10-30 curve has flattened further as supply/demand in the 30y sector of the Gilt market takes over. With month- / quarter- / fiscal year-end approaches in the next few days, long-end paper has gone “missing” and liquidity has drained away. End-users have petitioned the DMO for more long-end supply, and the GEMMs asking for the next long-end auction (of the 1t 57) to be brought forward: which it has been by a week to 10th April.
The catalyst for a reversal of this long-end richness could come today with the long-end APF, where the street is likely to offer in 57s in decent size (going short to cover at the auction). Once the year-end is done, the squeeze should abate further as the coming supply looms.
This is a tactical trade for the short-term, as factors exogenous to the UK could drive a further flattening. The 2y1y hedge might break down if there are major changes in rate expectations, so the stop is tight and the horizon of the trade should be one to two weeks.

The level regression has an R^2 of 77%.

Love to hear your thoughts!
Best wishes
David
David Sansom
![]() image001.jpg@01D21F13.B69A4950">
image001.jpg@01D21F13.B69A4950">
UK: 14-16 Dowgate Hill, London EC4R 2SU
US: 245 Park Ave, 39th Floor, NY, NY, 10167
Office: +44 (0) 203 143 4180
Mobile: +44 (0) 7976 204490
Email: david.sansom@astorridge.com
Web: www.AstorRidge.com
This marketing was prepared by David Sansom, a consultant with Astor Ridge. It is not appropriate to characterize this e-mail as independent investment research as referred to in MiFID and that it should be treated as a marketing communication even if it contains a trade recommendation. A history of marketing materials and research reports can be provided upon request in compliance with the European Commission’s Market Abuse Regulation. Astor Ridge takes no proprietary trading risk, has no market making facilities, and has no position in any security we discuss in this e-mail. The views in this e-mail are those of the author(s) and are subject to change, and Astor Ridge has no obligation to update its opinions or the information in this publication. If this e-mail contains opinions or recommendations, those opinions or recommendations reflect solely and exclusively those of the author, and such opinions were prepared independently of any other interests, including those of Astor Ridge and/or its affiliates. This publication does not constitute personal investment advice or take into account the individual financial circumstances or objectives of the those who receive it. The securities discussed herein may not be suitable for all investors. Astor Ridge recommends that investors independently evaluate each issuer, security or instrument discussed herein, and consult any independent advisors they believe necessary. The value of, and income from, any investment may fluctuate from day to day as a result of changes in relevant economic markets (including changes in market liquidity). The information herein is not intended to predict actual results, which may differ substantially from those reflected. Past performance is not necessarily indicative of future results.
You should not use or disclose to any other person the contents of this e-mail or its attachments (if any), nor take copies. This e-mail is not a representation or warranty and is not intended nor should it be taken to create any legal relations, contractual or otherwise. This e-mail and any files transmitted with it are confidential, may be legally privileged, and are for the sole use of the intended recipient. Copyright in this e-mail and any accompanying document created by Astor Ridge LLP is owned by Astor Ridge LLP.
Astor Ridge LLP is regulated by the Financial Conduct Authority (FCA): Registration Number 579287
Astor Ridge LLP is Registered in England and Wales with Companies House: Registration Number OC372185
Astor Ridge NA LLP is a member of FINRA/SIPC: CRD Number 282626
Astor Ridge NA LLP is Registered in England and Wales with Companies House: Registration Number OC401796
The PSPP2 data for Germany for March-18. Estimated WAM of Bund purchases at 7.9 years in the month.
Yesterday, the ECB released the PSPP2 data for March purchasing. The main points taken from my PSPP2 model:
- The WAM of German purchases fell back to 7.7 years in March, from 9.1 years in February;
- The estimated volume on Lander (or non-KFW) also reduced back to the more usual level (2.2bn down to 1.4bn)
- I estimate 0.85bn of redemption reinvestment flows in March
- Again, the largest per-issue purchases came in the 10y sector
- The model still shows minimal buying of the current 30y (Aug-48)
- The new Schatz (BKO 0% Mar-20) appeared in the Buba’s repo list at the end of March, so they have bought some (my model has 20mm)
The jury is still out on the impact of new month’s redemptions. My model suggests that nearly 6.8bn of Bunds will come out of the portfolio in April. Some of this will come from the OBL 0.25% Apr-18 (my estimate is 2.1bn) but the bulk is from the OBLei Apr-18 linker (4.7bn). Unfortunately all we know about the Buba and linkers is that they have bought at least some (the securities are available for lending), but that’s about it. Because they have been eligible for purchase from Day One of QE, my model has them bought all the way to the 33% issue limit, however the Buba may have a different treatment (also the treatment of the inflation uplift is unclear: does the Buba retain the inflation uplift in principal or does it get reinvested?).
The model’s results in detail:
The estimate for the WAM for purchases in January for the various categories of paper are as follows:
|
Category |
Notional |
WAM |
|
German Govt |
3.5 |
7.9 |
|
KFW |
0.5 |
8.1 |
|
Others (Lander) |
1.4 |
7.2 |
|
All Purchases |
5.4 |
7.7 |
The per-issue charts for monthly purchases, and available notional left to purchase:


Given the model’s estimates for purchasing, here is how I see the redemption flows in Bunds currently. Numbers for Apr-19 onwards will continue to rise as more purchases are made.
|
Redemptions |
||||
|
Govt |
KFW |
Lander |
Total |
|
|
Apr-17 |
0 |
0 |
0 |
0 |
|
May-17 |
0 |
0 |
0 |
0 |
|
Jun-17 |
0 |
0 |
0 |
0 |
|
Jul-17 |
0 |
0 |
0 |
0 |
|
Aug-17 |
0 |
0 |
0 |
0 |
|
Sep-17 |
0 |
101 |
47 |
148 |
|
Oct-17 |
6 |
188 |
0 |
193 |
|
Nov-17 |
0 |
164 |
90 |
254 |
|
Dec-17 |
0 |
0 |
0 |
0 |
|
Jan-18 |
73 |
153 |
0 |
226 |
|
Feb-18 |
657 |
278 |
0 |
935 |
|
Mar-18 |
710 |
0 |
137 |
847 |
|
Apr-18 |
6800 |
0 |
71 |
6871 |
|
May-18 |
0 |
0 |
114 |
114 |
|
Jun-18 |
1596 |
2970 |
340 |
4906 |
|
Jul-18 |
3478 |
1650 |
580 |
5708 |
|
Aug-18 |
0 |
0 |
81 |
81 |
|
Sep-18 |
2112 |
0 |
466 |
2579 |
|
Oct-18 |
4100 |
1650 |
650 |
6400 |
|
Nov-18 |
0 |
0 |
850 |
850 |
|
Dec-18 |
2540 |
1650 |
321 |
4511 |
|
Jan-19 |
6847 |
1980 |
860 |
9687 |
|
Feb-19 |
5196 |
0 |
626 |
5822 |
|
Mar-19 |
2010 |
3300 |
305 |
5615 |
|
Apr-19 |
5280 |
272 |
765 |
6316 |
|
May-19 |
0 |
0 |
561 |
561 |
|
Jun-19 |
1389 |
0 |
493 |
1882 |
|
Jul-19 |
7594 |
495 |
97 |
8186 |
|
Aug-19 |
0 |
660 |
336 |
996 |
|
Sep-19 |
818 |
0 |
642 |
1461 |
|
Oct-19 |
5280 |
1650 |
1921 |
8851 |
|
Nov-19 |
0 |
0 |
357 |
357 |
|
Dec-19 |
226 |
0 |
500 |
725 |
|
Jan-20 |
7141 |
3300 |
1583 |
12024 |
|
Feb-20 |
0 |
16 |
596 |
612 |
|
Mar-20 |
0 |
0 |
1298 |
1298 |
|
Apr-20 |
11771 |
0 |
113 |
11885 |
|
May-20 |
0 |
0 |
330 |
330 |
|
Jun-20 |
0 |
1650 |
543 |
2193 |
|
Jul-20 |
7259 |
0 |
1555 |
8814 |
|
Aug-20 |
0 |
0 |
481 |
481 |
|
Sep-20 |
5280 |
0 |
702 |
5982 |
|
Oct-20 |
5273 |
495 |
533 |
6301 |
|
Nov-20 |
0 |
0 |
1062 |
1062 |
|
Dec-20 |
0 |
0 |
740 |
740 |
|
Jan-21 |
6270 |
3630 |
939 |
10839 |
Or, in chart form:

Finally, here are the per-issue estimates for Bunds:
|
Bond |
Opened |
O/S (bn) |
Purchasable |
Market Yield |
Purchased |
% Purchased |
Remaining |
Margin of Error |
MV Remaining |
Mar-18 Buying |
|
DBR 3.75% 04-Jan-17 |
Nov-06 |
0.0 |
0.0 |
|
0.0 |
|
0.0 |
|
0.0 |
0.0 |
|
OBL 0.75% 24-Feb-17 |
Jan-12 |
0.0 |
0.0 |
|
0.0 |
|
0.0 |
|
0.0 |
0.0 |
|
BKO 0% 10-Mar-17 |
Feb-15 |
0.0 |
0.0 |
|
0.0 |
|
0.0 |
|
0.0 |
0.0 |
|
OBL 0.5% 07-Apr-17 |
May-12 |
0.0 |
0.0 |
|
0.0 |
|
0.0 |
|
0.0 |
0.0 |
|
BKO 0% 16-Jun-17 |
May-15 |
0.0 |
0.0 |
|
0.0 |
|
0.0 |
|
0.0 |
0.0 |
|
DBR 4.25% 04-Jul-17 |
May-07 |
0.0 |
0.0 |
|
0.0 |
|
0.0 |
|
0.0 |
0.0 |
|
BKO 0% 15-Sep-17 |
Aug-15 |
0.0 |
0.0 |
|
0.0 |
|
0.0 |
|
0.0 |
0.0 |
|
OBL 0.5% 13-Oct-17 |
Sep-12 |
0.0 |
0.0 |
|
0.0 |
|
0.0 |
+/- 45% |
0.0 |
0.0 |
|
BKO 0% 15-Dec-17 |
Nov-15 |
0.0 |
0.0 |
|
0.0 |
|
0.0 |
|
0.0 |
0.0 |
|
DBR 4% 04-Jan-18 |
Nov-07 |
0.0 |
0.0 |
|
0.1 |
|
0.0 |
+/- 9% |
0.0 |
0.0 |
|
OBL 0.5% 23-Feb-18 |
Jan-13 |
0.0 |
0.0 |
0.7 |
0.0 |
+/- 3% |
0.0 |
0.0 |
||
|
BKO 0% 16-Mar-18 |
Feb-16 |
0.0 |
0.0 |
0.7 |
0.0 |
+/- 4% |
0.0 |
0.0 |
||
|
OBL 0.25% 13-Apr-18 |
May-13 |
17.0 |
0.0 |
-0.752 |
2.1 |
0.0 |
+/- 2% |
0.0 |
0.0 |
|
|
OBLI 0.75% 15-Apr-18 |
Apr-11 |
15.0 |
0.0 |
4.7 |
0.0 |
+/- 1% |
0.0 |
0.0 |
||
|
BKO 0% 15-Jun-18 |
May-16 |
14.0 |
0.0 |
-0.680 |
1.6 |
0.0 |
+/- 3% |
0.0 |
0.0 |
|
|
DBR 4.25% 04-Jul-18 |
May-08 |
21.0 |
0.0 |
-0.700 |
3.5 |
0.0 |
+/- 1% |
0.0 |
0.0 |
|
|
BKO 0% 14-Sep-18 |
Aug-16 |
13.0 |
0.0 |
-0.671 |
2.1 |
0.0 |
+/- 2% |
0.0 |
0.0 |
|
|
OBL 1% 12-Oct-18 |
Sep-13 |
17.0 |
0.0 |
-0.678 |
4.1 |
0.0 |
+/- 2% |
0.0 |
0.0 |
|
|
BKO 0% 14-Dec-18 |
Nov-16 |
13.0 |
0.0 |
-0.670 |
2.5 |
0.0 |
+/- 2% |
0.0 |
0.0 |
|
|
DBR 3.75% 04-Jan-19 |
Nov-08 |
24.0 |
0.0 |
-0.710 |
6.8 |
0.0 |
+/- 1% |
0.0 |
0.0 |
|
|
OBL 1% 22-Feb-19 |
Jan-14 |
16.0 |
0.0 |
-0.675 |
5.2 |
0.0 |
+/- 1% |
0.0 |
0.0 |
|
|
BKO 0% 15-Mar-19 |
Mar-17 |
13.0 |
0.0 |
-0.677 |
2.0 |
|
0.0 |
+/- 2% |
0.0 |
0.1 |
|
OBL 0.5% 12-Apr-19 |
May-14 |
16.0 |
5.3 |
-0.674 |
5.3 |
100% |
0.0 |
+/- 0% |
0.0 |
0.0 |
|
BKO 0% 14-Jun-19 |
May-17 |
13.0 |
4.3 |
-0.648 |
1.4 |
32% |
2.9 |
+/- 2% |
2.9 |
0.1 |
|
DBR 3.5% 04-Jul-19 |
May-09 |
24.0 |
7.9 |
-0.648 |
7.6 |
96% |
0.3 |
+/- 1% |
0.4 |
0.2 |
|
BKO 0% 13-Sep-19 |
Aug-17 |
13.0 |
4.3 |
-0.646 |
0.8 |
19% |
3.5 |
+/- 3% |
3.5 |
0.1 |
|
OBL 0.25% 11-Oct-19 |
Sep-14 |
16.0 |
5.3 |
-0.633 |
5.3 |
100% |
0.0 |
+/- 0% |
0.0 |
0.0 |
|
BKO 0% 13-Dec-19 |
Nov-17 |
13.0 |
4.3 |
-0.631 |
0.2 |
5% |
4.1 |
+/- 6% |
4.1 |
0.1 |
|
DBR 3.25% 04-Jan-20 |
Nov-09 |
22.0 |
7.3 |
-0.633 |
7.1 |
98% |
0.1 |
+/- 1% |
0.1 |
0.2 |
|
BKO 0% 13-Mar-20 |
Feb-18 |
9.0 |
3.0 |
-0.596 |
0.0 |
0% |
3.0 |
|
3.0 |
0.0 |
|
DBRI 1.75% 15-Apr-20 |
Jun-09 |
16.0 |
5.3 |
|
5.3 |
100% |
0.0 |
+/- 0% |
0.0 |
0.0 |
|
OBL 0% 17-Apr-20 |
Jan-15 |
20.0 |
6.6 |
-0.582 |
6.5 |
98% |
0.1 |
+/- 1% |
0.1 |
0.2 |
|
DBR 3% 04-Jul-20 |
Apr-10 |
22.0 |
7.3 |
-0.559 |
7.3 |
100% |
0.0 |
+/- 0% |
0.0 |
0.1 |
|
DBR 2.25% 04-Sep-20 |
Aug-10 |
16.0 |
5.3 |
-0.541 |
5.3 |
100% |
0.0 |
+/- 0% |
0.0 |
0.0 |
|
OBL 0.25% 16-Oct-20 |
Jul-15 |
19.0 |
6.3 |
-0.534 |
5.3 |
84% |
1.0 |
+/- 1% |
1.0 |
0.2 |
|
DBR 2.5% 04-Jan-21 |
Nov-10 |
19.0 |
6.3 |
-0.496 |
6.3 |
100% |
0.0 |
+/- 0% |
0.0 |
0.0 |
|
OBL 0% 09-Apr-21 |
Feb-16 |
21.0 |
6.9 |
-0.451 |
4.9 |
71% |
2.0 |
+/- 1% |
2.0 |
0.2 |
|
DBR 3.25% 04-Jul-21 |
Apr-11 |
19.0 |
6.3 |
-0.410 |
6.3 |
100% |
0.0 |
+/- 0% |
0.0 |
0.0 |
|
DBR 2.25% 04-Sep-21 |
Aug-11 |
16.0 |
5.3 |
-0.371 |
5.3 |
100% |
0.0 |
+/- 0% |
0.0 |
0.0 |
|
OBL 0% 08-Oct-21 |
Jul-16 |
19.0 |
6.3 |
-0.361 |
4.2 |
66% |
2.1 |
+/- 2% |
2.1 |
0.2 |
|
DBR 2% 04-Jan-22 |
Nov-11 |
20.0 |
6.6 |
-0.321 |
6.6 |
100% |
0.0 |
+/- 0% |
0.0 |
0.0 |
|
OBL 0% 08-Apr-22 |
Feb-17 |
18.0 |
5.9 |
-0.277 |
2.4 |
40% |
3.6 |
+/- 2% |
3.6 |
0.2 |
|
DBR 1.75% 04-Jul-22 |
Apr-12 |
24.0 |
7.9 |
-0.256 |
7.9 |
100% |
0.0 |
+/- 0% |
0.0 |
0.0 |
|
DBR 1.5% 04-Sep-22 |
Sep-12 |
18.0 |
5.9 |
-0.222 |
5.9 |
100% |
0.0 |
+/- 0% |
0.0 |
0.0 |
|
OBL 0% 07-Oct-22 |
Jul-17 |
17.0 |
5.6 |
-0.188 |
1.1 |
19% |
4.5 |
+/- 3% |
4.6 |
0.2 |
|
DBR 1.5% 15-Feb-23 |
Jan-13 |
18.0 |
5.9 |
-0.151 |
5.9 |
100% |
0.0 |
+/- 0% |
0.0 |
0.0 |
|
OBL 0% 14-Apr-23 |
Feb-18 |
11.0 |
3.6 |
-0.090 |
0.1 |
2% |
3.6 |
+/- 10% |
3.6 |
0.0 |
|
DBRI 0.1% 15-Apr-23 |
Mar-12 |
16.0 |
5.3 |
|
5.3 |
100% |
0.0 |
+/- 0% |
0.0 |
0.0 |
|
DBR 1.5% 15-May-23 |
May-13 |
18.0 |
5.9 |
-0.101 |
5.9 |
100% |
0.0 |
+/- 0% |
0.0 |
0.0 |
|
DBR 2% 15-Aug-23 |
Sep-13 |
18.0 |
5.9 |
-0.055 |
5.9 |
100% |
0.0 |
+/- 0% |
0.0 |
0.0 |
|
DBR 6.25% 04-Jan-24 |
Jan-94 |
10.3 |
3.4 |
-0.004 |
3.4 |
100% |
0.0 |
+/- 0% |
0.0 |
0.0 |
|
DBR 1.75% 15-Feb-24 |
Jan-14 |
18.0 |
5.9 |
0.022 |
5.9 |
100% |
0.0 |
+/- 0% |
0.0 |
0.0 |
|
DBR 1.5% 15-May-24 |
May-14 |
18.0 |
5.9 |
0.056 |
5.9 |
100% |
0.0 |
+/- 0% |
0.0 |
0.0 |
|
DBR 1% 15-Aug-24 |
Sep-14 |
18.0 |
5.9 |
0.091 |
5.9 |
100% |
0.0 |
+/- 0% |
0.0 |
0.0 |
|
DBR 0.5% 15-Feb-25 |
Jan-15 |
23.0 |
7.6 |
0.151 |
7.6 |
100% |
0.0 |
+/- 0% |
0.0 |
0.0 |
|
DBR 1% 15-Aug-25 |
Jul-15 |
23.0 |
7.6 |
0.204 |
7.6 |
100% |
0.0 |
+/- 0% |
0.0 |
0.0 |
|
DBR 0.5% 15-Feb-26 |
Jan-16 |
26.0 |
8.6 |
0.269 |
8.6 |
100% |
0.0 |
+/- 0% |
0.0 |
0.0 |
|
DBRI 0.1% 15-Apr-26 |
Mar-15 |
13.5 |
4.5 |
|
3.5 |
79% |
0.9 |
+/- 2% |
1.1 |
0.1 |
|
DBR 0% 15-Aug-26 |
Jul-16 |
25.0 |
8.3 |
0.333 |
7.2 |
88% |
1.0 |
+/- 1% |
1.0 |
0.3 |
|
DBR 0.25% 15-Feb-27 |
Jan-17 |
26.0 |
8.6 |
0.389 |
3.3 |
38% |
5.3 |
+/- 1% |
5.2 |
0.3 |
|
DBR 6.5% 04-Jul-27 |
Jul-97 |
11.2 |
3.7 |
0.380 |
3.7 |
100% |
0.0 |
+/- 0% |
0.0 |
0.0 |
|
DBR 0.5% 15-Aug-27 |
Jul-17 |
25.0 |
8.3 |
0.452 |
1.2 |
14% |
7.1 |
+/- 2% |
7.1 |
0.2 |
|
DBR 5.625% 04-Jan-28 |
Jan-98 |
14.5 |
4.8 |
0.450 |
4.8 |
100% |
0.0 |
+/- 0% |
0.0 |
0.0 |
|
DBR 0.5% 15-Feb-28 |
Jan-18 |
14.0 |
4.6 |
0.513 |
0.1 |
1% |
4.6 |
+/- 11% |
4.6 |
0.0 |
|
DBR 4.75% 04-Jul-28 |
Oct-98 |
11.3 |
3.7 |
0.495 |
3.7 |
100% |
0.0 |
+/- 0% |
0.0 |
0.0 |
|
DBR 6.25% 04-Jan-30 |
Jan-00 |
9.3 |
3.1 |
0.571 |
3.1 |
100% |
0.0 |
+/- 0% |
0.0 |
0.0 |
|
DBRI 0.5% 15-Apr-30 |
Apr-14 |
10.0 |
3.3 |
|
3.1 |
95% |
0.2 |
+/- 2% |
0.2 |
0.0 |
|
DBR 5.5% 04-Jan-31 |
Oct-00 |
17.0 |
5.6 |
0.649 |
5.6 |
100% |
0.0 |
+/- 0% |
0.0 |
0.0 |
|
DBR 4.75% 04-Jul-34 |
Jan-03 |
20.0 |
6.6 |
0.823 |
6.6 |
100% |
0.0 |
+/- 0% |
0.0 |
0.0 |
|
DBR 4% 04-Jan-37 |
Jan-05 |
23.0 |
7.6 |
0.915 |
7.6 |
100% |
0.0 |
+/- 0% |
0.0 |
0.0 |
|
DBR 4.25% 04-Jul-39 |
Jan-07 |
14.0 |
4.6 |
0.973 |
4.6 |
100% |
0.0 |
+/- 0% |
0.0 |
0.0 |
|
DBR 4.75% 04-Jul-40 |
Jul-08 |
16.0 |
5.3 |
0.988 |
5.2 |
98% |
0.1 |
+/- 1% |
0.2 |
0.1 |
|
DBR 3.25% 04-Jul-42 |
Jul-10 |
15.0 |
5.0 |
1.051 |
5.0 |
100% |
0.0 |
+/- 0% |
0.0 |
0.0 |
|
DBR 2.5% 04-Jul-44 |
Apr-12 |
23.5 |
7.8 |
1.106 |
6.6 |
85% |
1.1 |
+/- 1% |
1.5 |
0.2 |
|
DBRI 0.1% 15-Apr-46 |
Jun-15 |
7.0 |
2.3 |
|
1.4 |
60% |
0.9 |
+/- 2% |
1.1 |
0.1 |
|
DBR 2.5% 15-Aug-46 |
Feb-14 |
23.0 |
7.6 |
1.125 |
5.7 |
75% |
1.9 |
+/- 1% |
2.6 |
0.2 |
|
DBR 1.25% 15-Aug-48 |
Sep-17 |
7.0 |
2.3 |
1.166 |
0.2 |
9% |
2.1 |
+/- 5% |
2.2 |
0.0 |
|
Italic = index-linked |
Total |
57.8 |
3.5 |
|||||||
|
Yield below Depo Floor |
||||||||||
|
Yield above Depo Floor |
Bund WAM |
7.9 |
David Sansom
![]() image001.jpg@01D21F13.B69A4950">
image001.jpg@01D21F13.B69A4950">
UK: 14-16 Dowgate Hill, London EC4R 2SU
US: 245 Park Ave, 39th Floor, NY, NY, 10167
Office: +44 (0) 203 143 4180
Mobile: +44 (0) 7976 204490
Email: david.sansom@astorridge.com
Web: www.AstorRidge.com
This marketing was prepared by David Sansom, a consultant with Astor Ridge. It is not appropriate to characterize this e-mail as independent investment research as referred to in MiFID and that it should be treated as a marketing communication even if it contains a trade recommendation. A history of marketing materials and research reports can be provided upon request in compliance with the European Commission’s Market Abuse Regulation. Astor Ridge takes no proprietary trading risk, has no market making facilities, and has no position in any security we discuss in this e-mail. The views in this e-mail are those of the author(s) and are subject to change, and Astor Ridge has no obligation to update its opinions or the information in this publication. If this e-mail contains opinions or recommendations, those opinions or recommendations reflect solely and exclusively those of the author, and such opinions were prepared independently of any other interests, including those of Astor Ridge and/or its affiliates. This publication does not constitute personal investment advice or take into account the individual financial circumstances or objectives of the those who receive it. The securities discussed herein may not be suitable for all investors. Astor Ridge recommends that investors independently evaluate each issuer, security or instrument discussed herein, and consult any independent advisors they believe necessary. The value of, and income from, any investment may fluctuate from day to day as a result of changes in relevant economic markets (including changes in market liquidity). The information herein is not intended to predict actual results, which may differ substantially from those reflected. Past performance is not necessarily indicative of future results.
You should not use or disclose to any other person the contents of this e-mail or its attachments (if any), nor take copies. This e-mail is not a representation or warranty and is not intended nor should it be taken to create any legal relations, contractual or otherwise. This e-mail and any files transmitted with it are confidential, may be legally privileged, and are for the sole use of the intended recipient. Copyright in this e-mail and any accompanying document created by Astor Ridge LLP is owned by Astor Ridge LLP.
Astor Ridge LLP is regulated by the Financial Conduct Authority (FCA): Registration Number 579287
Astor Ridge LLP is Registered in England and Wales with Companies House: Registration Number OC372185
Astor Ridge NA LLP is a member of FINRA/SIPC: CRD Number 282626
Astor Ridge NA LLP is Registered in England and Wales with Companies House: Registration Number OC401796
Tactical Year-end Trade: GBP 10-30 steepener hedged with short-rates
Bottom-line: GBP 10-30 has flattened too far relative to short-rate expectations, as demand of long-end UK paper has outstripped supply in the thin market ahead of fiscal year-end. Set a tactical steepener, hedged with a regression-weighted amount of short-rates. One to look at today, ahead of this afternoon’s long-end APF.
Trade:
Recv GBP 107mm 1y10y swap
Pay GBP 40.5mm 1y30y swap
Pay 255mm 2y1y swap
(equivalent to GBP 100k/bp on the 10y-30y and 25k/bp of 2y1y)
Positive rolldown of +0.5bp over the first 3m.
Bloomberg CIX for the relationship:
100 * (BPSW0130 Curncy - BPSW0110 Curncy) + 25 * BPSW0201 Curncy
On this index, enter at 29. Target 36bp. Stop at 26.5bp.
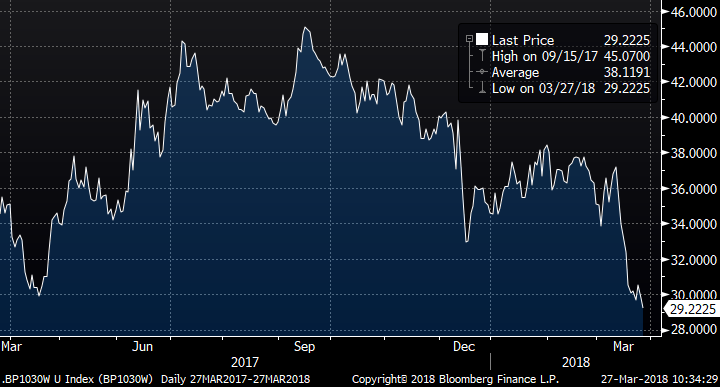
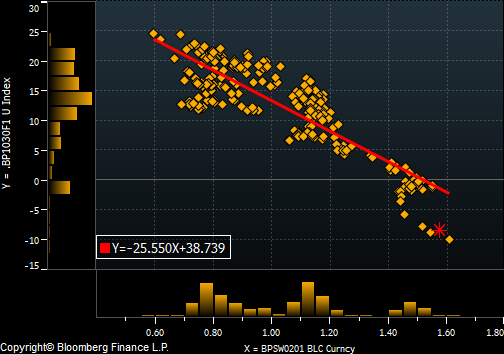
The residual of the 10-30 vs 25% 2y1y regression (using the 1:0.25 weights):
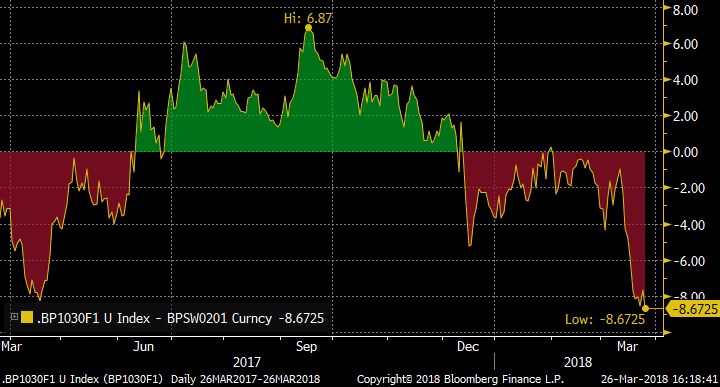
Rationale: For the past year, as the UK has moved towards a hiking cycle, the long-end curve slope has been correlated with the short rate (as exemplified by 2y1y) as it has in the US. However in the past month, the 10-30 curve has flattened further as supply/demand in the 30y sector of the Gilt market takes over. With month- / quarter- / fiscal year-end approaches in the next few days, long-end paper has gone “missing” and liquidity has drained away. End-users have petitioned the DMO for more long-end supply, and the GEMMs asking for the next long-end auction (of the 1t 57) to be brought forward: which it has been by a week to 10th April.
The catalyst for a reversal of this long-end richness could come today with the long-end APF, where the street is likely to offer in 57s in decent size (going short to cover at the auction). Once the year-end is done, the squeeze should abate further as the coming supply looms.
This is a tactical trade for the short-term, as factors exogenous to the UK could drive a further flattening. The 2y1y hedge might break down if there are major changes in rate expectations, so the stop is tight and the horizon of the trade should be one to two weeks.
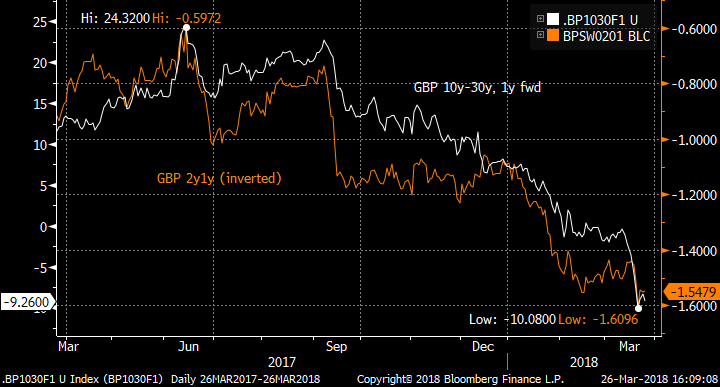
The level regression has an R^2 of 77%.
Love to hear your thoughts!
Best wishes
David
David Sansom
![]() image001.jpg@01D21F13.B69A4950">
image001.jpg@01D21F13.B69A4950">
UK: 14-16 Dowgate Hill, London EC4R 2SU
US: 245 Park Ave, 39th Floor, NY, NY, 10167
Office: +44 (0) 203 143 4180
Mobile: +44 (0) 7976 204490
Email: david.sansom@astorridge.com
Web: www.AstorRidge.com
This marketing was prepared by David Sansom, a consultant with Astor Ridge. It is not appropriate to characterize this e-mail as independent investment research as referred to in MiFID and that it should be treated as a marketing communication even if it contains a trade recommendation. A history of marketing materials and research reports can be provided upon request in compliance with the European Commission’s Market Abuse Regulation. Astor Ridge takes no proprietary trading risk, has no market making facilities, and has no position in any security we discuss in this e-mail. The views in this e-mail are those of the author(s) and are subject to change, and Astor Ridge has no obligation to update its opinions or the information in this publication. If this e-mail contains opinions or recommendations, those opinions or recommendations reflect solely and exclusively those of the author, and such opinions were prepared independently of any other interests, including those of Astor Ridge and/or its affiliates. This publication does not constitute personal investment advice or take into account the individual financial circumstances or objectives of the those who receive it. The securities discussed herein may not be suitable for all investors. Astor Ridge recommends that investors independently evaluate each issuer, security or instrument discussed herein, and consult any independent advisors they believe necessary. The value of, and income from, any investment may fluctuate from day to day as a result of changes in relevant economic markets (including changes in market liquidity). The information herein is not intended to predict actual results, which may differ substantially from those reflected. Past performance is not necessarily indicative of future results.
You should not use or disclose to any other person the contents of this e-mail or its attachments (if any), nor take copies. This e-mail is not a representation or warranty and is not intended nor should it be taken to create any legal relations, contractual or otherwise. This e-mail and any files transmitted with it are confidential, may be legally privileged, and are for the sole use of the intended recipient. Copyright in this e-mail and any accompanying document created by Astor Ridge LLP is owned by Astor Ridge LLP.
Astor Ridge LLP is regulated by the Financial Conduct Authority (FCA): Registration Number 579287
Astor Ridge LLP is Registered in England and Wales with Companies House: Registration Number OC372185
Astor Ridge NA LLP is a member of FINRA/SIPC: CRD Number 282626
Astor Ridge NA LLP is Registered in England and Wales with Companies House: Registration Number OC401796
Portfolio update: Closing out GBP/USD 2y-10y, 1y fwd box trade for profit
There’s been a quick bounce in the level of the GBP/USD 2y-10y, 1y fwd box trade, as the Sterling curve has flattened rapidly, while in recent days the US curve flattening has stalled. The original target was flat, but I’m booking the quick profit of 14.5 bp here. I am holding the CMS cap version of this trade on a long-term view.
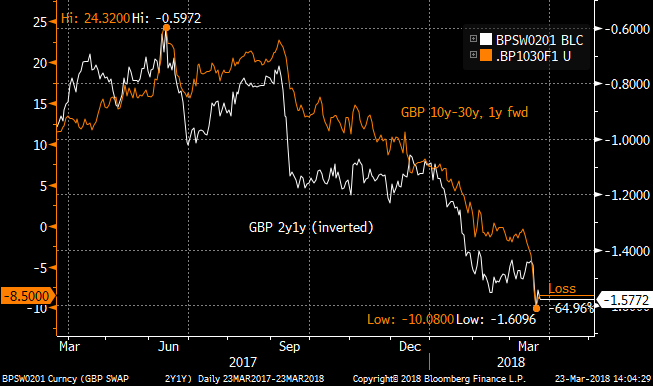
Part of the reason for the tactical profit take is that the GBP curve may have got ahead of itself: eg the GBP 10-30 curve which has been in focus, having again flattened hard in the Gilt market. The chart shows the inverse relationship between 10y-30y (in this case 1y fwd) and the 2y1y forward rate (which acts as a proxy for MPC rate-hike expectations). Hence the 10-30 curve has been bear-flattening, which is in line with my trade themes above.
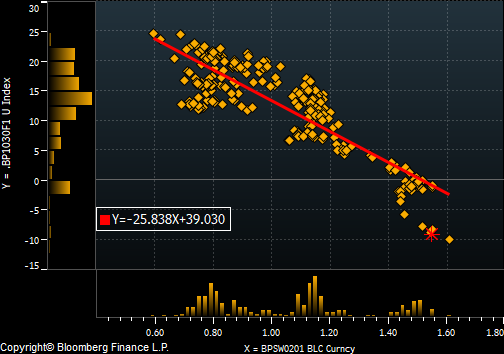
The regression between 10-30, 1y fwd and 2y1y has an R^2 of 77%.
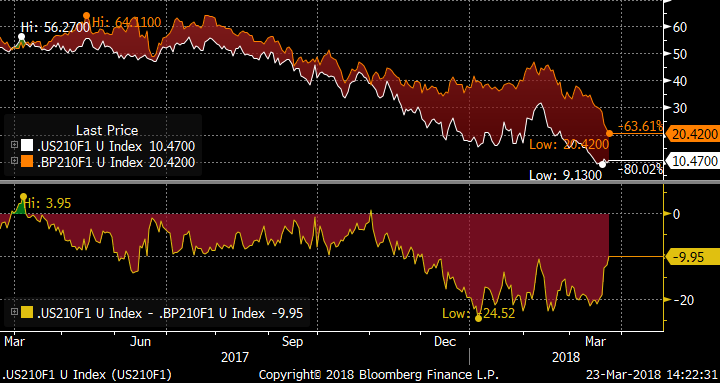
And this is the residual of the relationship, suggesting that the 10-30 flattening has been more aggressive than indicated by the changes in short-term rate expectations. The Gilt market has been the driver as 30y paper has gone missing into fiscal year-end. The minutes of the last DMO meeting showed that dealers were petitioning for long-end paper, and Friday’s auction schedule announcement showed that the long auctions had been moved a week earlier than usual. Interestingly the relationship held up well through yesterday’s MPC meeting, and the residual moved off the -8bp extreme.
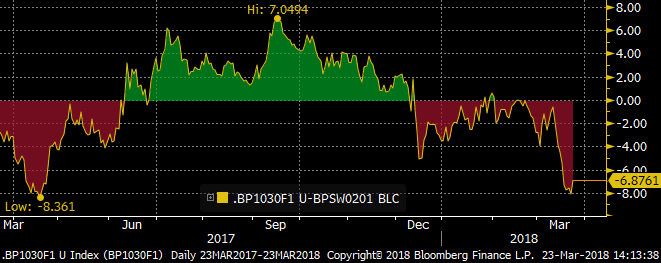
One structure then to capture this dislocation is to:
Pay 100k/bp 10y-30y, 1y fwd
Pay 25k/bp 2y1y fwd rate
To position for a re-steepening of 10y-30y relative to short-rate expectations.
Best wishes
David
Original write-up from 21st Feb:
Bottom line: The US curve (however it is viewed) is at, or close to its flattest for the last 20 years, as the Fed hikes rates. At the same time, though the GBP curve has flattened somewhat it is still significantly steeper than before the financial crisis of 2008, despite the market pricing hikes from the MPC. Thus in isolation we would independently favour a steepener in the US and a flattener in the UK. Given the relatively high realized correlation between the US and UK on certain curve sectors, there is a good case to be made for looking at the box trade.
Trade(s):
In vanilla swaps:
Recv USD 525mm 1y2y
Pay USD 116mm 1y10y
Pay GBP 365mm 1y2y
Recv GBP 77mm 1y10y
Equivalent to USD 100k/bp on the box
Enter at -25.5bp. Target flat (0bp). Stop at -32bp. Rolldown over first 3m: -0.8bp.
In CMS spread caps:
Buy USD 1bn 1y expiry CMS 10y-2y cap atmf + 5bp (k=25.1bp)
Sell GBP 718mm 1y expiry CMS 10y-2y cap atmf + 10bp (k=54.8bp)
For zero cost (indicative mid)
Forward entry at -29.7bp.
The chart:
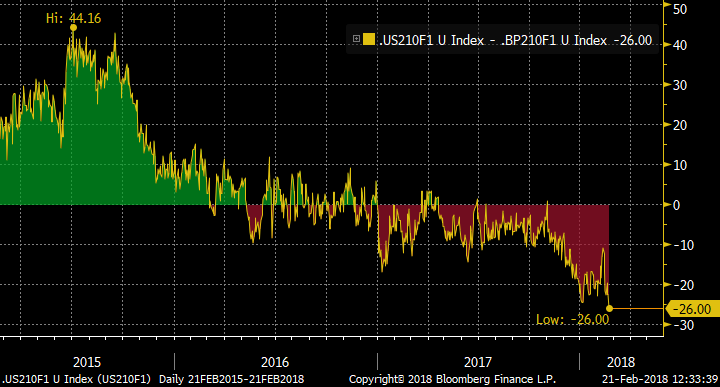
Rationale: The market is pricing two to three more hikes from the FOMC over the next 12 months. Over the same period, the MPC is forecast to hike once or maybe twice. For the ECB, the EONIA market is not even pricing one hike.
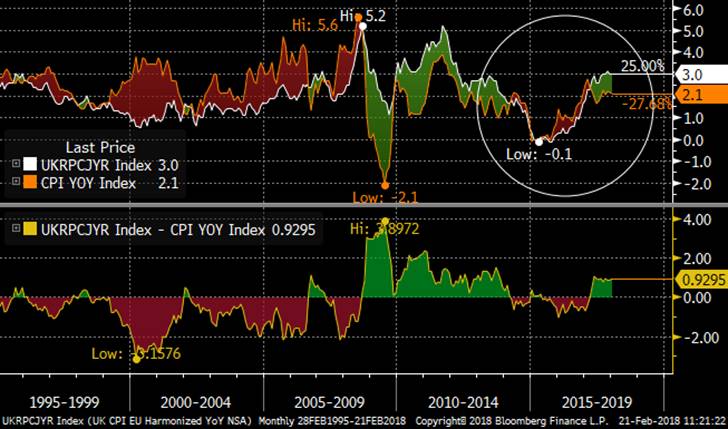
This chart shows the CPI history of the US and UK. The reflation in the UK since 2015 is matching, if not outpacing the US, and on this metric the MPC looks to be a little late to the hiking party. Of course, the elephant in the room is BREXIT with all its associated uncertainties: a ill-controlled departure from the EU could weaken Sterling and import further inflation while the apparent contraction in the labour force (from falling numbers of EU nationals) could continue to push wages higher. Or not, if some accommodation is thrashed out with the EU 27. That is not to say the US does not have inflationary pressures of its own, from rising wages to possible increased infrastructure (and other) spending.
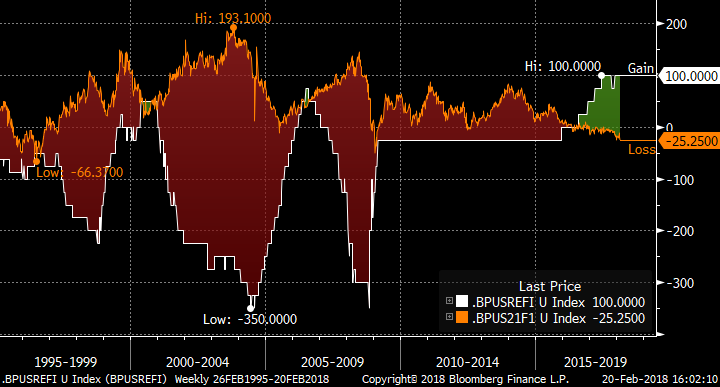
The next chart shows the differential between US and UK refi rates, overlaid with the history of the US-GBP 2y-10y, 1y forward curve box. The policy rate spread, at 100bp is the highest for the last 20 years. Beneath this is the spread between the Eurodollar and Short Sterling strips, which shows the rate differential forecast to increase to 150bp by Q2 19 before starting to narrow gradually. Effectively the market is pricing that the Fed will be pretty done a year to 18 months from now, while the BoE will still be on a hiking path (albeit a shallow one). The empirical history of the curve box from the 2004 – 2006 period saw the US curve flattening faster than the GBP in the early stages of the hiking cycle, before the box sharply changed direction in early ’06 as the MPC vacillated between cutting and hiking. It was at this point that the UK curve started flattening in earnest. Even though the short rate differential between the Fed and BoE was still widening, the box level rose.

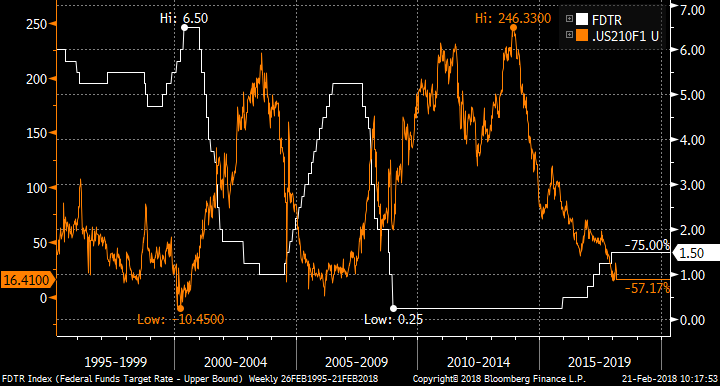
Taking each country in turn, this chart shows the US side of things: the Fed target rate vs USD 2y-10y, 1y fwd. The ’04-’06 period in the US saw the curve flattening classically as the belly of the curve could not keep pace with rising short rates. This process continued until roughly halfway through the hiking cycle, which is arguably where we are in the current cycle with another 4 or so hikes to come as priced by the market. Having flattened to its lows in the 10bp area, the curve held within a choppy range for the next 18 months. Thus the argument for the present day is that, given the forward curve is back to the previous cycle lows and the hiking cycle has matured, the next move from the US curve will be sideways, if not steeper. This is before an increasing US bond term premium is factored in.
The corresponding chart for the UK shows a curve that has yet to embrace the prospect of a tightening rate cycle. The GBP 2y-10y, 1y forward curve is close to its local lows since 2008 (though has steepened back a shade in the past month), but well above the flat/inverted levels observed before the financial crisis. It is fair to note that the term premium in the UK should be higher now given the fog of BREXIT, but we have yet to see the degree of flattening associated with the MPC’s previous hiking period in ’04 to ’07.
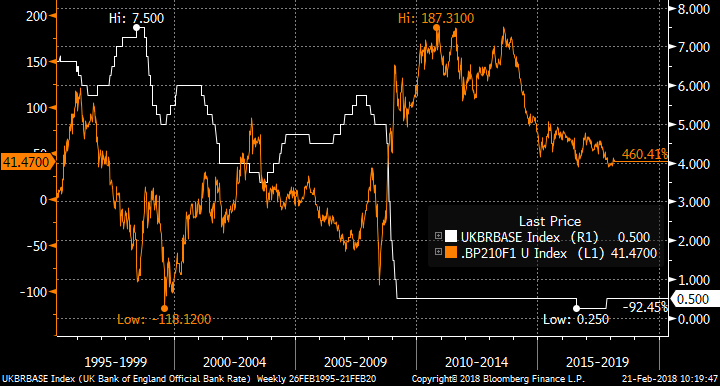
Why have I focused on 2y-10y and not other curve segments? The next chart shows three candidate box trades (2-10y, 5y-30y and 10y-30y). All three are very low levels historically. However at around 23bp inverted (on the spot 2y-10y), this sector looks the most stretched compared to the previous range.

There is another reason to prefer 2y-10y for the box. This chart shows the rolling realized 6m correlation between various USD and GBP curve sectors. While 5y-30y and 10y-30y correlations have remained in the 20-year range, the 2y-10y curves have become more correlated since 2011. Correlation is key on cross-market trades, otherwise the box is simply two orthogonal curve trades.

This correlation is visible in the recent history of the US/GBP 2y-10y, 1y forward curves.

An alternative way to vanilla swaps is to use CMS spread options. Re-visiting the recent history of the 2y-10y, 1y forward curves, the box has been directional in terms of curve as the US leg has been more volatile than the GBP side: heading lower as curves flattened. Thus it is interesting to look at the expression via CMS spread caps, buying a USD cap and selling the GBP. If the US curve continues to flatten, with the GBP curve following, then both options expire out of the money. On a steepening move, empirically we might expect the US curve to steepen more than the GBP and so the USD cap would prove to be more valuable than the GBP one.

The other reason to express the trade via caps rather than floors is that GBP curve implied volatility is higher than in USD, which is the opposite of relative realized volatilities (see table). The 1y expiry offers the greatest implied volatility pick-up in bp/y.
|
2y-10y implied volatility |
Realized Vol |
||||
|
3m |
6m |
1y |
2y |
3m |
|
|
USD |
39 |
38 |
37 |
35 |
36 |
|
GBP |
41 |
41 |
40 |
37 |
33 |
|
Ratio USD/GBP |
0.95 |
0.93 |
0.93 |
0.95 |
1.08 |
This differential allows us to improve the entry level on the box versus the vanilla swap structure. As usual, I like to have the option that I am short slightly out-of-the-money compared to the atmf, so this structure is approximately zero cost (mid):
Buy USD 1bn 1y expiry CMS 10y-2y cap atmf + 5bp (k=25.1bp)
Sell GBP 718mm 1y expiry CMS 10y-2y cap atmf + 10bp (k=54.8bp)
Thus the forward entry is at -29.7bp (indicative), beating the vanilla trade by 4bp.
I look forward to any and all comments you might have!
Best wishes,
David
David Sansom
![]() image001.jpg@01D21F13.B69A4950">
image001.jpg@01D21F13.B69A4950">
UK: 14-16 Dowgate Hill, London EC4R 2SU
US: 245 Park Ave, 39th Floor, NY, NY, 10167
Office: +44 (0) 203 143 4180
Mobile: +44 (0) 7976 204490
Email: david.sansom@astorridge.com
Web: www.AstorRidge.com
This marketing was prepared by David Sansom, a consultant with Astor Ridge. It is not appropriate to characterize this e-mail as independent investment research as referred to in MiFID and that it should be treated as a marketing communication even if it contains a trade recommendation. A history of marketing materials and research reports can be provided upon request in compliance with the European Commission’s Market Abuse Regulation. Astor Ridge takes no proprietary trading risk, has no market making facilities, and has no position in any security we discuss in this e-mail. The views in this e-mail are those of the author(s) and are subject to change, and Astor Ridge has no obligation to update its opinions or the information in this publication. If this e-mail contains opinions or recommendations, those opinions or recommendations reflect solely and exclusively those of the author, and such opinions were prepared independently of any other interests, including those of Astor Ridge and/or its affiliates. This publication does not constitute personal investment advice or take into account the individual financial circumstances or objectives of the those who receive it. The securities discussed herein may not be suitable for all investors. Astor Ridge recommends that investors independently evaluate each issuer, security or instrument discussed herein, and consult any independent advisors they believe necessary. The value of, and income from, any investment may fluctuate from day to day as a result of changes in relevant economic markets (including changes in market liquidity). The information herein is not intended to predict actual results, which may differ substantially from those reflected. Past performance is not necessarily indicative of future results.
You should not use or disclose to any other person the contents of this e-mail or its attachments (if any), nor take copies. This e-mail is not a representation or warranty and is not intended nor should it be taken to create any legal relations, contractual or otherwise. This e-mail and any files transmitted with it are confidential, may be legally privileged, and are for the sole use of the intended recipient. Copyright in this e-mail and any accompanying document created by Astor Ridge LLP is owned by Astor Ridge LLP.
Astor Ridge LLP is regulated by the Financial Conduct Authority (FCA): Registration Number 579287
Astor Ridge LLP is Registered in England and Wales with Companies House: Registration Number OC372185
Astor Ridge NA LLP is a member of FINRA/SIPC: CRD Number 282626
Astor Ridge NA LLP is Registered in England and Wales with Companies House: Registration Number OC401796
