So you want to put on a USD steepener? Still too early, as I see it.
Writing as someone who spent most of 2017 looking for the US curve to steepen and was sorely disappointed, I am hesitant to revisit the topic. In retrospect, longer rates could not keep pace with the steady rise in short rates in response to Fed action. In this article, I’m proposing a checklist to assess the timing of various curve structures.
Executive Summary: There seems to be little to recommend steepeners yet on the USD curve. I’ve analysed a variety of common USD curve structures all of which dipped to their lows during the last Fed hiking cycle in 2004/2006. When I compare the levels today to that period, the vast majority of structures are still off those minima, and momentum indicators suggest they still have room to move lower. Most of the curves did not reach their lows until the hiking cycle was almost done: currently we are only halfway on this period of FOMC action. Added to that, the bulk also show a bear-flattening dynamic over the past 3 months (to a greater or lesser degree of statistical certainty) so given my bias is that US rates are heading higher in the short term it is hard to recommend steepeners yet. The rolldown is generally in your favour, but is not enough to compensate for the potential downside of early adoption. The possible exception is paying USD 2-5-10, 3m fwd, but that has already moved some way is rolldown negative.
In more detail:
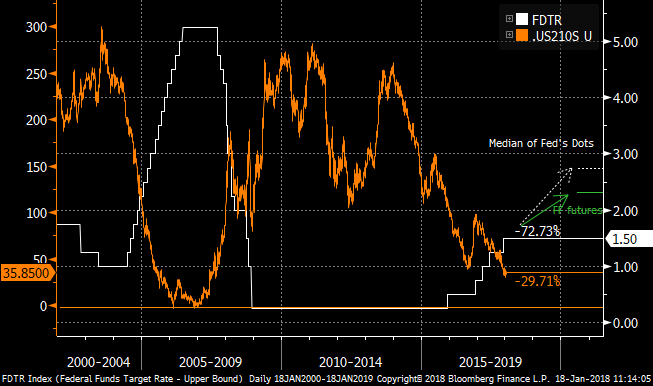
To set the scene, here’s a chart of the Fed Target Rate and the USD 2y-10y spot slope in swaps. I’ve annotated the chart with the Fed’s and the market’s projection of where the Fed rate is headed over the next two years. The market’s pricing sees the Fed Funds rate as topping out around 2.30% by Q1 2020 ie around three more 25bp hikes from here. On that basis we are roughly half-way through the hiking cycle (if not a little further advanced). At the same stage in the 2004/2006 period, the curve still had further to flatten, though the low was reached first around three hikes before the end of that cycle.

What checklist can we use to determine whether curve relationships have moved far enough?
I’ll use the basis USD 2y-10y swap curve as an example.
1. Where and, equally importantly, when was the minimum in the 2004-2006 cycle? The FOMC first hiked rates in June 2004 and announced what turned out to be the final hike in June 2006. Historically, the USD 2y-10y curve first hit its flattest at around 0bp. This happened around March 2006, so roughly 21 months into a 24 month or 87% of the period. Currently 2y-10y in swaps is 39bp, and it’s reasonable to suggest we are 50% through the current cycle (which I am suggesting started with the Dec-16 hike). On this basis, the spot 2y-10y curve has further to flatten.
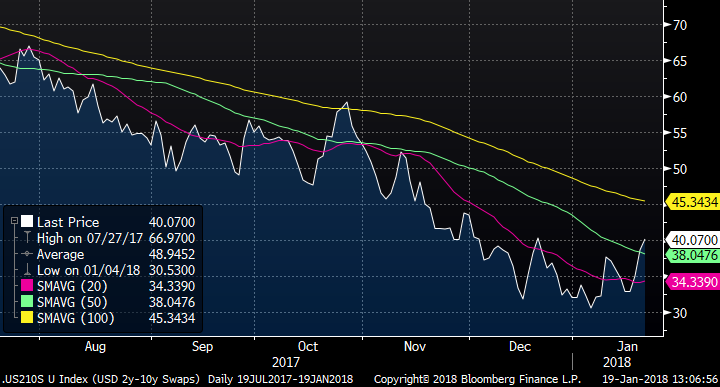
2. Is the momentum for flattening showing any signs of relenting? During 2017, the flattening on 2y-10y was remorseless, as the market first unwound the post-Trump steepening (10y rates falling while 2y rates stable) and then priced Fed action which had 2y selling off faster than 10y. The chart for the last 6 months and the moving averages are shown in the chart. I’m using 20-, 50- and 100-day moving averages.

In general, a steepening move would see changes to moving averages in the following time order:
- The gap between the 20-day and 50-day moving averages reduces;
- The 20-day moving average bottoms out and starts to increase;
- The 20-day moving average crosses the 50-day.
As each condition is fulfilled the likelihood of a steepening increases. It’s a trading choice as to how aggressively to target the absolute low, rather than await further confirmation and miss the most extreme entry point. Inspection of the chart shows that the first condition is being satisfied (the moving 20- and 50-day averages are converging), and the second is also (just) being fulfilled. For an “early adopter” this might be sufficient to initiate a steepener, while others might wait for the two moving averages to cross.
3. Will the steepener make any money? Just because the curve has stopped flattening, it does not necessarily follow that the steepener will be a quick win. Back in 2006, the USD 2y-10y curve did bounce 25bp or so off its lows immediately after hitting the Mar-16 low (though it gave all those gains back over the next three months).
4. Is curve rolldown on your side, and is it significant? It is always preferable to have the rolldown on your side (even if the roll is not realized). The 3m fwd 2y-10y curve is 30bp compared to spot 2y-10y at 39bp, so a steepener set 3m fwd will have 9bp of apparent rolldown. To assess whether this roll is significant, we can look at the 3m realized volatility which is currently 2bp/day, or 16bp over a 3m horizon (assuming a normal distribution). As a quasi-Sharpe ratio this comes out at 56%. Whether this ratio is attractive is again a matter for the investor. Books could be written on whether rolldown actually materializes: the Fed hikes seem fairly baked-in, so the spot 2y rate could easily evolve to the 3m fwd market expectation, and the theoretical rolldown would not be captured.
5. What is the realized and anticipated directionality of the trade? The 10y rate has been lagging moves in short rates, and the curve has been bear-flattening. In the event of a large rally in long rates caused by global events, the curve could switch to bull-flattening; conversely increased Treasury supply expectations could drive a bear-steepening if 10y rates start to catch up. This is particularly relevant if you are looking to improve the risk/reward and entry level of the trade by using swaptions or mid-curves in a conditional structure.
Applying these metrics to a selection of US curve measures:
|
|
|
1. History |
2. Momentum |
3. Upside |
4. Rolldown |
5. Directionality |
||||
|
Curve Trade |
Current |
Minimum ’04-‘06 |
%age of ’04-’06 cycle |
Moving Averages |
Move from low (04/06) |
3m Rolldown |
Realized Daily Vol |
Rolldown Sharpe |
Recent Mode |
R2 vs long rate (3m) |
|
2y-5y, 3m fwd |
20 bp |
-3 bp |
86% |
üûû |
12 bp |
3 bp |
2.0 bp |
19% |
Bear flatten |
33% |
|
2y-10y, 3m fwd |
33 bp |
-4 bp |
86% |
üûû |
31 bp |
8 bp |
2.6 bp |
38% |
Bear flatten |
20% |
|
2y-30y, 3m fwd |
41 bp |
-6 bp |
86% |
üûû |
42 bp |
10 bp |
2.8 bp |
45% |
Bear flatten |
2% |
|
5y-10y, 3m fwd |
14 bp |
-2 bp |
86% |
üûû |
18 bp |
2 bp |
2.4 bp |
10% |
Bear flatten |
26% |
|
5y-30y, 3m fwd |
23 bp |
-2 bp |
86% |
üûû |
33 bp |
6 bp |
2.8 bp |
27% |
Bear flatten |
5% |
|
10-30y, 3m fwd |
8 bp |
-1 bp |
86% |
ûûû |
15 bp |
3 bp |
2.0 bp |
19% |
Bear flatten |
14% |
|
2y-10y, 1y fwd |
21 bp |
1 bp |
86% |
üûû |
29 bp |
3 bp |
2.4 bp |
16% |
Bear flatten |
36% |
|
2y-10y, 2y fwd |
16 bp |
0 bp |
86% |
üûû |
38 bp |
1 bp |
2.6 bp |
5% |
Bear flatten |
43% |
|
2y-10y, 5y fwd |
10 bp |
2 bp |
86% |
ûûû |
13 bp |
1 bp |
2.0 bp |
6% |
Bear flatten |
55% |
|
2y3y v 5y5y |
19 bp |
-2 bp |
86% |
üûû |
32 bp |
0 bp |
3.0 bp |
0% |
Bear flatten |
33% |
|
5y5y v 10y20y |
-1 bp |
0 bp |
87% |
ûûû |
12 bp |
1 bp |
2.3 bp |
5% |
Bear flatten |
76% |
|
2y1y v 3y1y |
5 bp |
0 bp |
62% |
üûû |
9 bp |
1 bp |
3.1 bp |
4% |
Bear flatten |
14% |
|
2-5-10, 3m fwd |
3 bp |
-10 bp |
64% |
üüü |
8 bp |
-4 bp |
3.5 bp |
-14% |
Bear steepen |
24% |
Do you agree with this methodology? Would love to hear your thoughts!
Best wishes,
David
David Sansom
![]() image001.jpg@01D21F13.B69A4950">
image001.jpg@01D21F13.B69A4950">
UK: 60 Cannon Street, London, EC4N 6NP
US: 245 Park Ave, 39th Floor, NY, NY, 10167
Office: +44 (0) 207 002 1346
Mobile: +44 (0) 7976 204490
Email: david.sansom@astorridge.com
Web: www.AstorRidge.com
This marketing was prepared by David Sansom, a consultant with Astor Ridge. It is not appropriate to characterize this e-mail as independent investment research as referred to in MiFID and that it should be treated as a marketing communication even if it contains a trade recommendation. A history of marketing materials and research reports can be provided upon request in compliance with the European Commission’s Market Abuse Regulation. Astor Ridge takes no proprietary trading risk, has no market making facilities, and has no position in any security we discuss in this e-mail. The views in this e-mail are those of the author(s) and are subject to change, and Astor Ridge has no obligation to update its opinions or the information in this publication. If this e-mail contains opinions or recommendations, those opinions or recommendations reflect solely and exclusively those of the author, and such opinions were prepared independently of any other interests, including those of Astor Ridge and/or its affiliates. This publication does not constitute personal investment advice or take into account the individual financial circumstances or objectives of the those who receive it. The securities discussed herein may not be suitable for all investors. Astor Ridge recommends that investors independently evaluate each issuer, security or instrument discussed herein, and consult any independent advisors they believe necessary. The value of, and income from, any investment may fluctuate from day to day as a result of changes in relevant economic markets (including changes in market liquidity). The information herein is not intended to predict actual results, which may differ substantially from those reflected. Past performance is not necessarily indicative of future results.
You should not use or disclose to any other person the contents of this e-mail or its attachments (if any), nor take copies. This e-mail is not a representation or warranty and is not intended nor should it be taken to create any legal relations, contractual or otherwise. This e-mail and any files transmitted with it are confidential, may be legally privileged, and are for the sole use of the intended recipient. Copyright in this e-mail and any accompanying document created by Astor Ridge LLP is owned by Astor Ridge LLP.
Astor Ridge LLP is regulated by the Financial Conduct Authority (FCA): Registration Number 579287
Astor Ridge LLP is Registered in England and Wales with Companies House: Registration Number OC372185
Astor Ridge NA LLP is a member of FINRA/SIPC: CRD Number 282626
Astor Ridge NA LLP is Registered in England and Wales with Companies House: Registration Number OC401796
